Part of the Arizona Enrollment SeriesET. Updated weekly.
Correction: An earlier version of this article stated that every grade level had at least doubled since 2018 and that the combined losses from Mesa, Chandler, Gilbert, and Kyrene totaled 21,118 students. Most grade levels doubled, but five (including kindergarten, up 61.6%) did not, and the four-district loss totals 21,119 students. The article has been updated.
In a state where 300 school districts are shrinking and six Kyrene schools are closing for good, Queen Creek Unified District↗ET added 374 students last year.
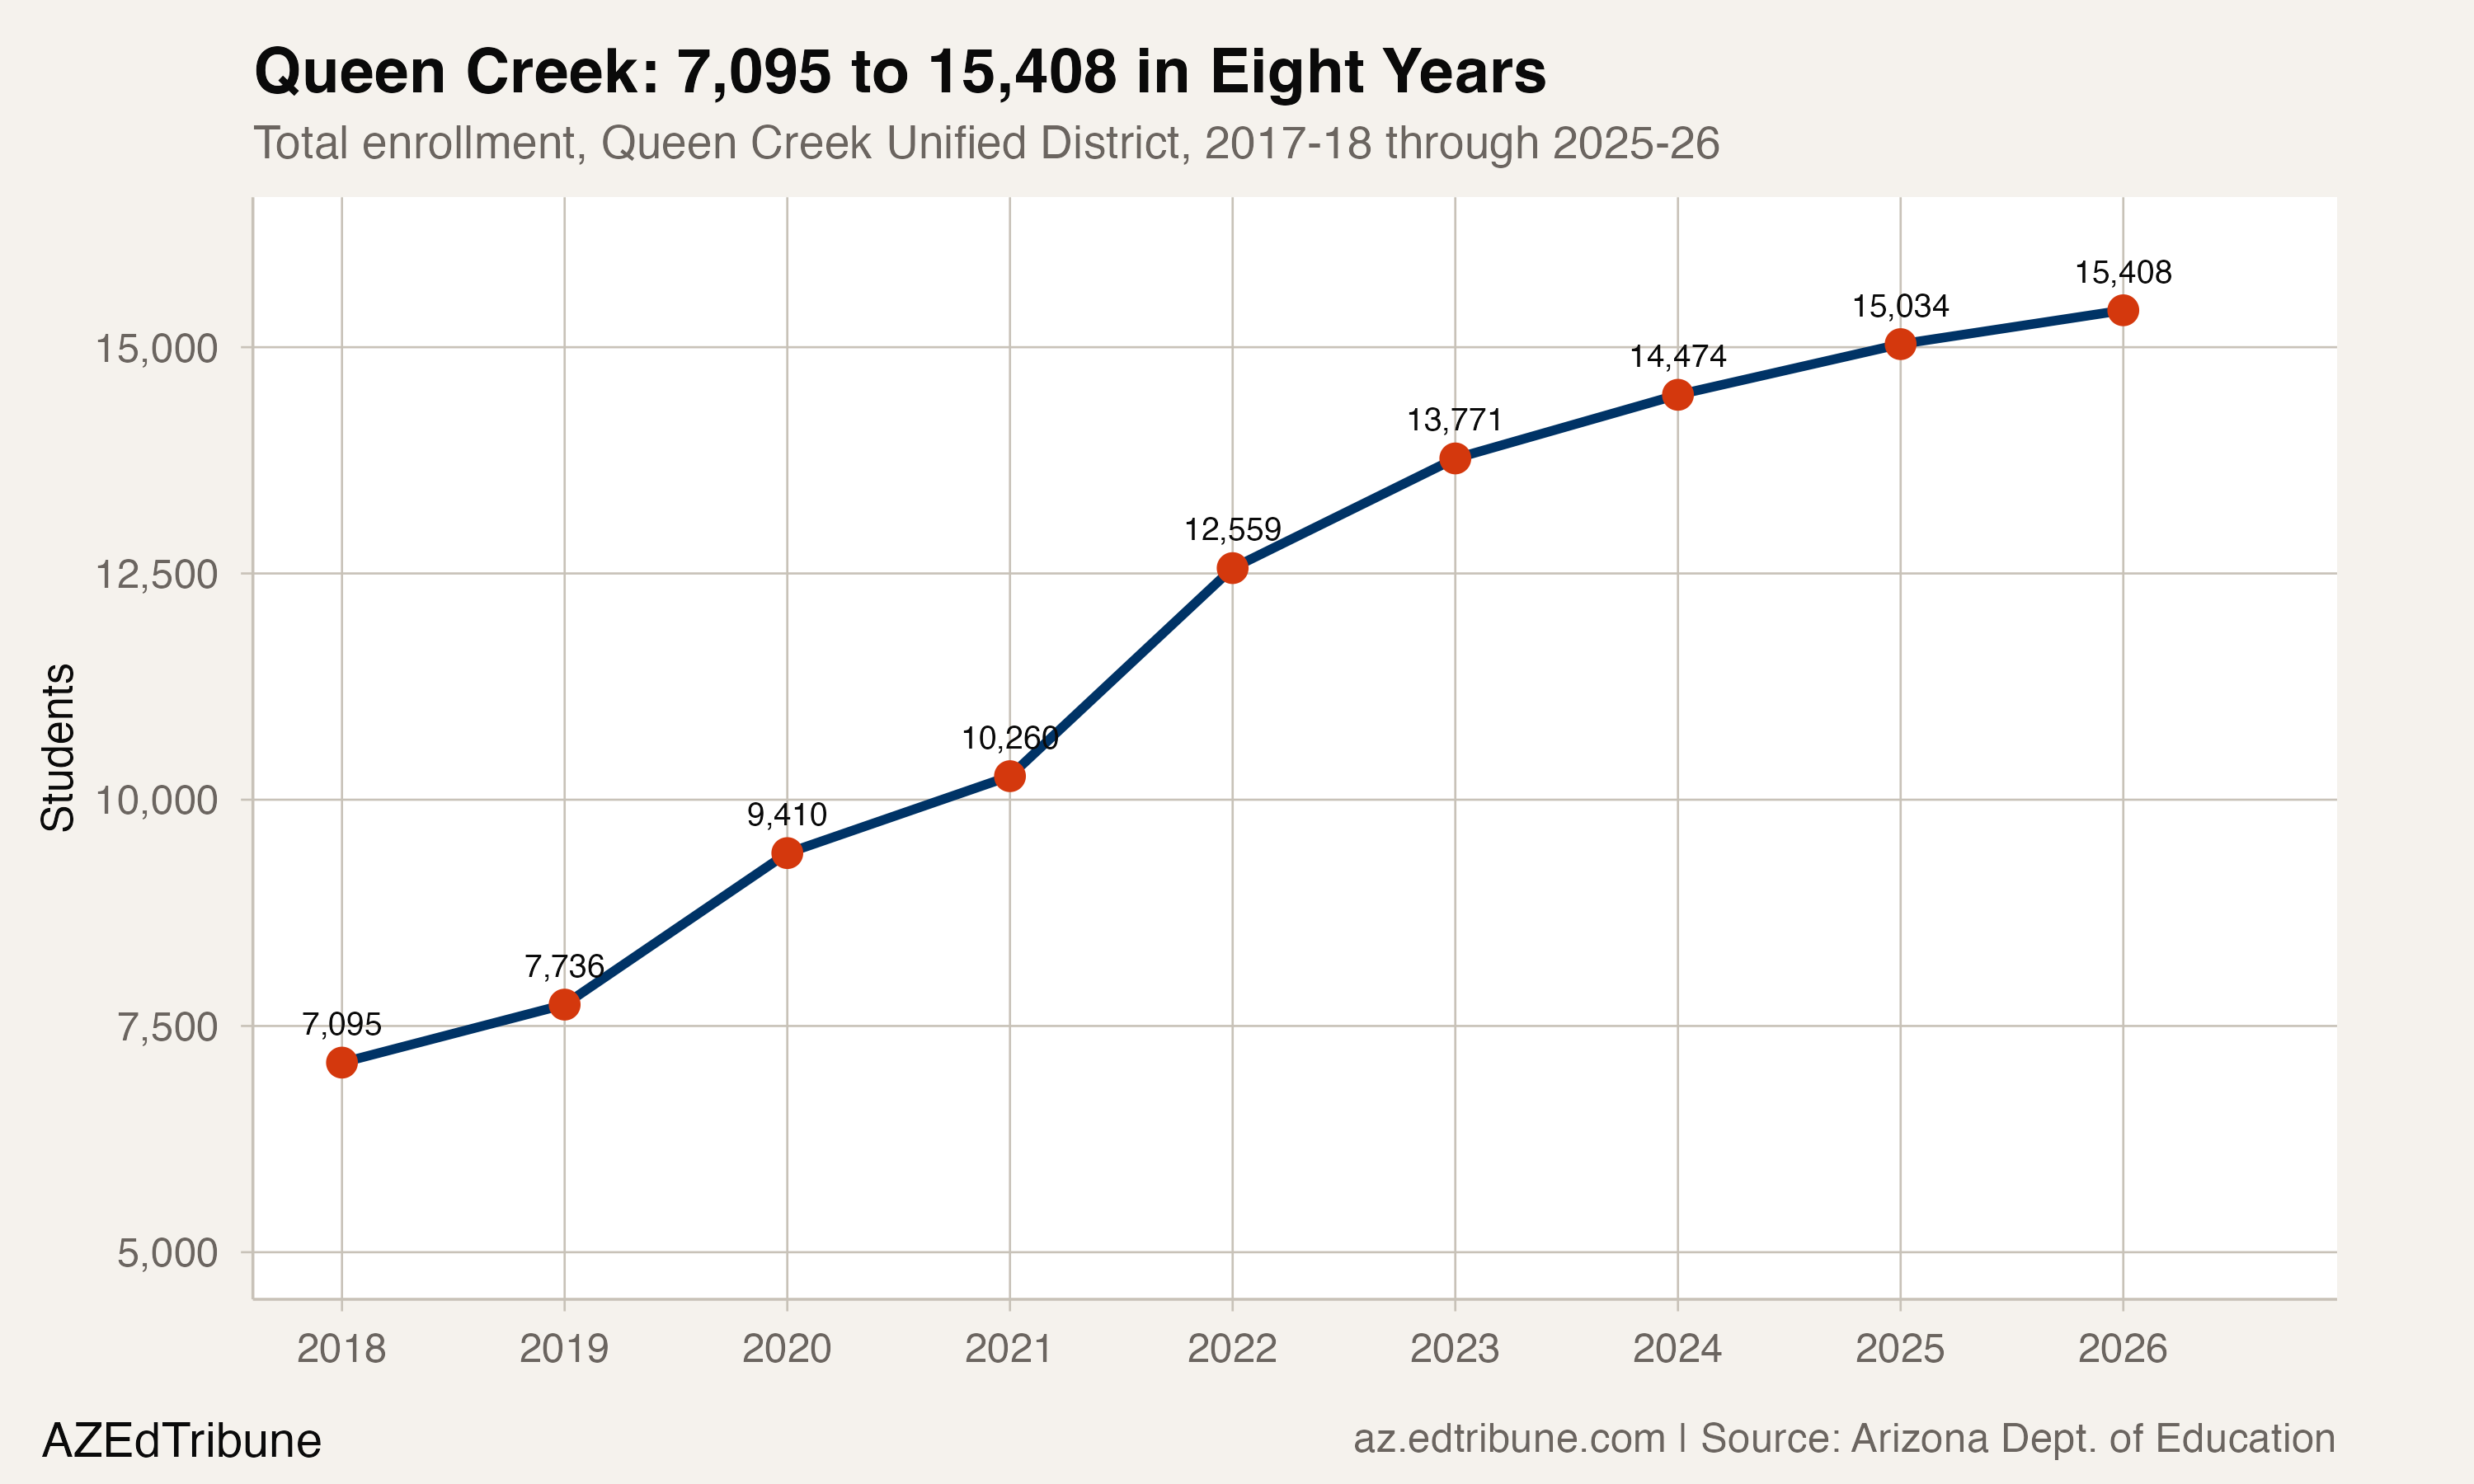
That number does not sound like much. It is worth pausing on anyway. Queen Creek has grown every year for eight consecutive years, from 7,095 students in 2017-18 to 15,408 in 2025-26, a 117.2% increase that makes it the fastest-growing traditional public school district in Arizona. No other traditional district in the state has doubled enrollment over the same period.
But the trajectory has changed. In 2021-22, Queen Creek added 2,299 students, a 22.4% surge in a single year. By 2025-26, the annual gain had fallen to 374, or 2.5%. The district is still growing. It is no longer booming.
Built to Grow
Queen Creek's enrollment curve is a direct imprint of residential construction in the far southeast Phoenix metro. The town's population has more than doubled over the past decade to approximately 84,000 residents, fueled by more than 8,000 single-family building permits issued in five years. Master-planned communities, including the 7,000-home Eastmark development straddling the Queen Creek-Mesa border, have delivered thousands of families with school-age children directly into the district's attendance boundaries.
The district has built to match. Mountain Trail Academy, a new elementary school, opened in 2025 to serve the northern part of the district where development has been heaviest. Expansions at Eastmark and Crismon high schools added capacity at the secondary level. In November 2024, voters reauthorized a 15% maintenance and operations override that supports smaller class sizes and teacher retention.
Most grade levels have at least doubled since 2018, but the growth is uneven. High school grades grew the fastest: grade 11 enrollment surged 165.2%, from 445 to 1,180 students, and grade 9 grew 150.5%. Kindergarten, by contrast, grew 61.6%, less than half the rate of the upper grades. That gap signals something important: the earliest arrivals brought older children. New families moving into completed subdivisions tend to enroll students across the grade spectrum all at once. As the housing stock matures and initial move-in waves subside, growth increasingly depends on the pipeline of younger children.
The S-Curve
The year-over-year data reveals a textbook deceleration pattern. Queen Creek's annual gains peaked in 2021-22 at 2,299 students, a 22.4% jump. That year coincided with the post-pandemic enrollment recovery and a construction surge in Eastmark and surrounding developments. Since then, annual additions have declined each year: 1,212 in 2022-23, 703 in 2023-24, 560 in 2024-25, and 374 in 2025-26.
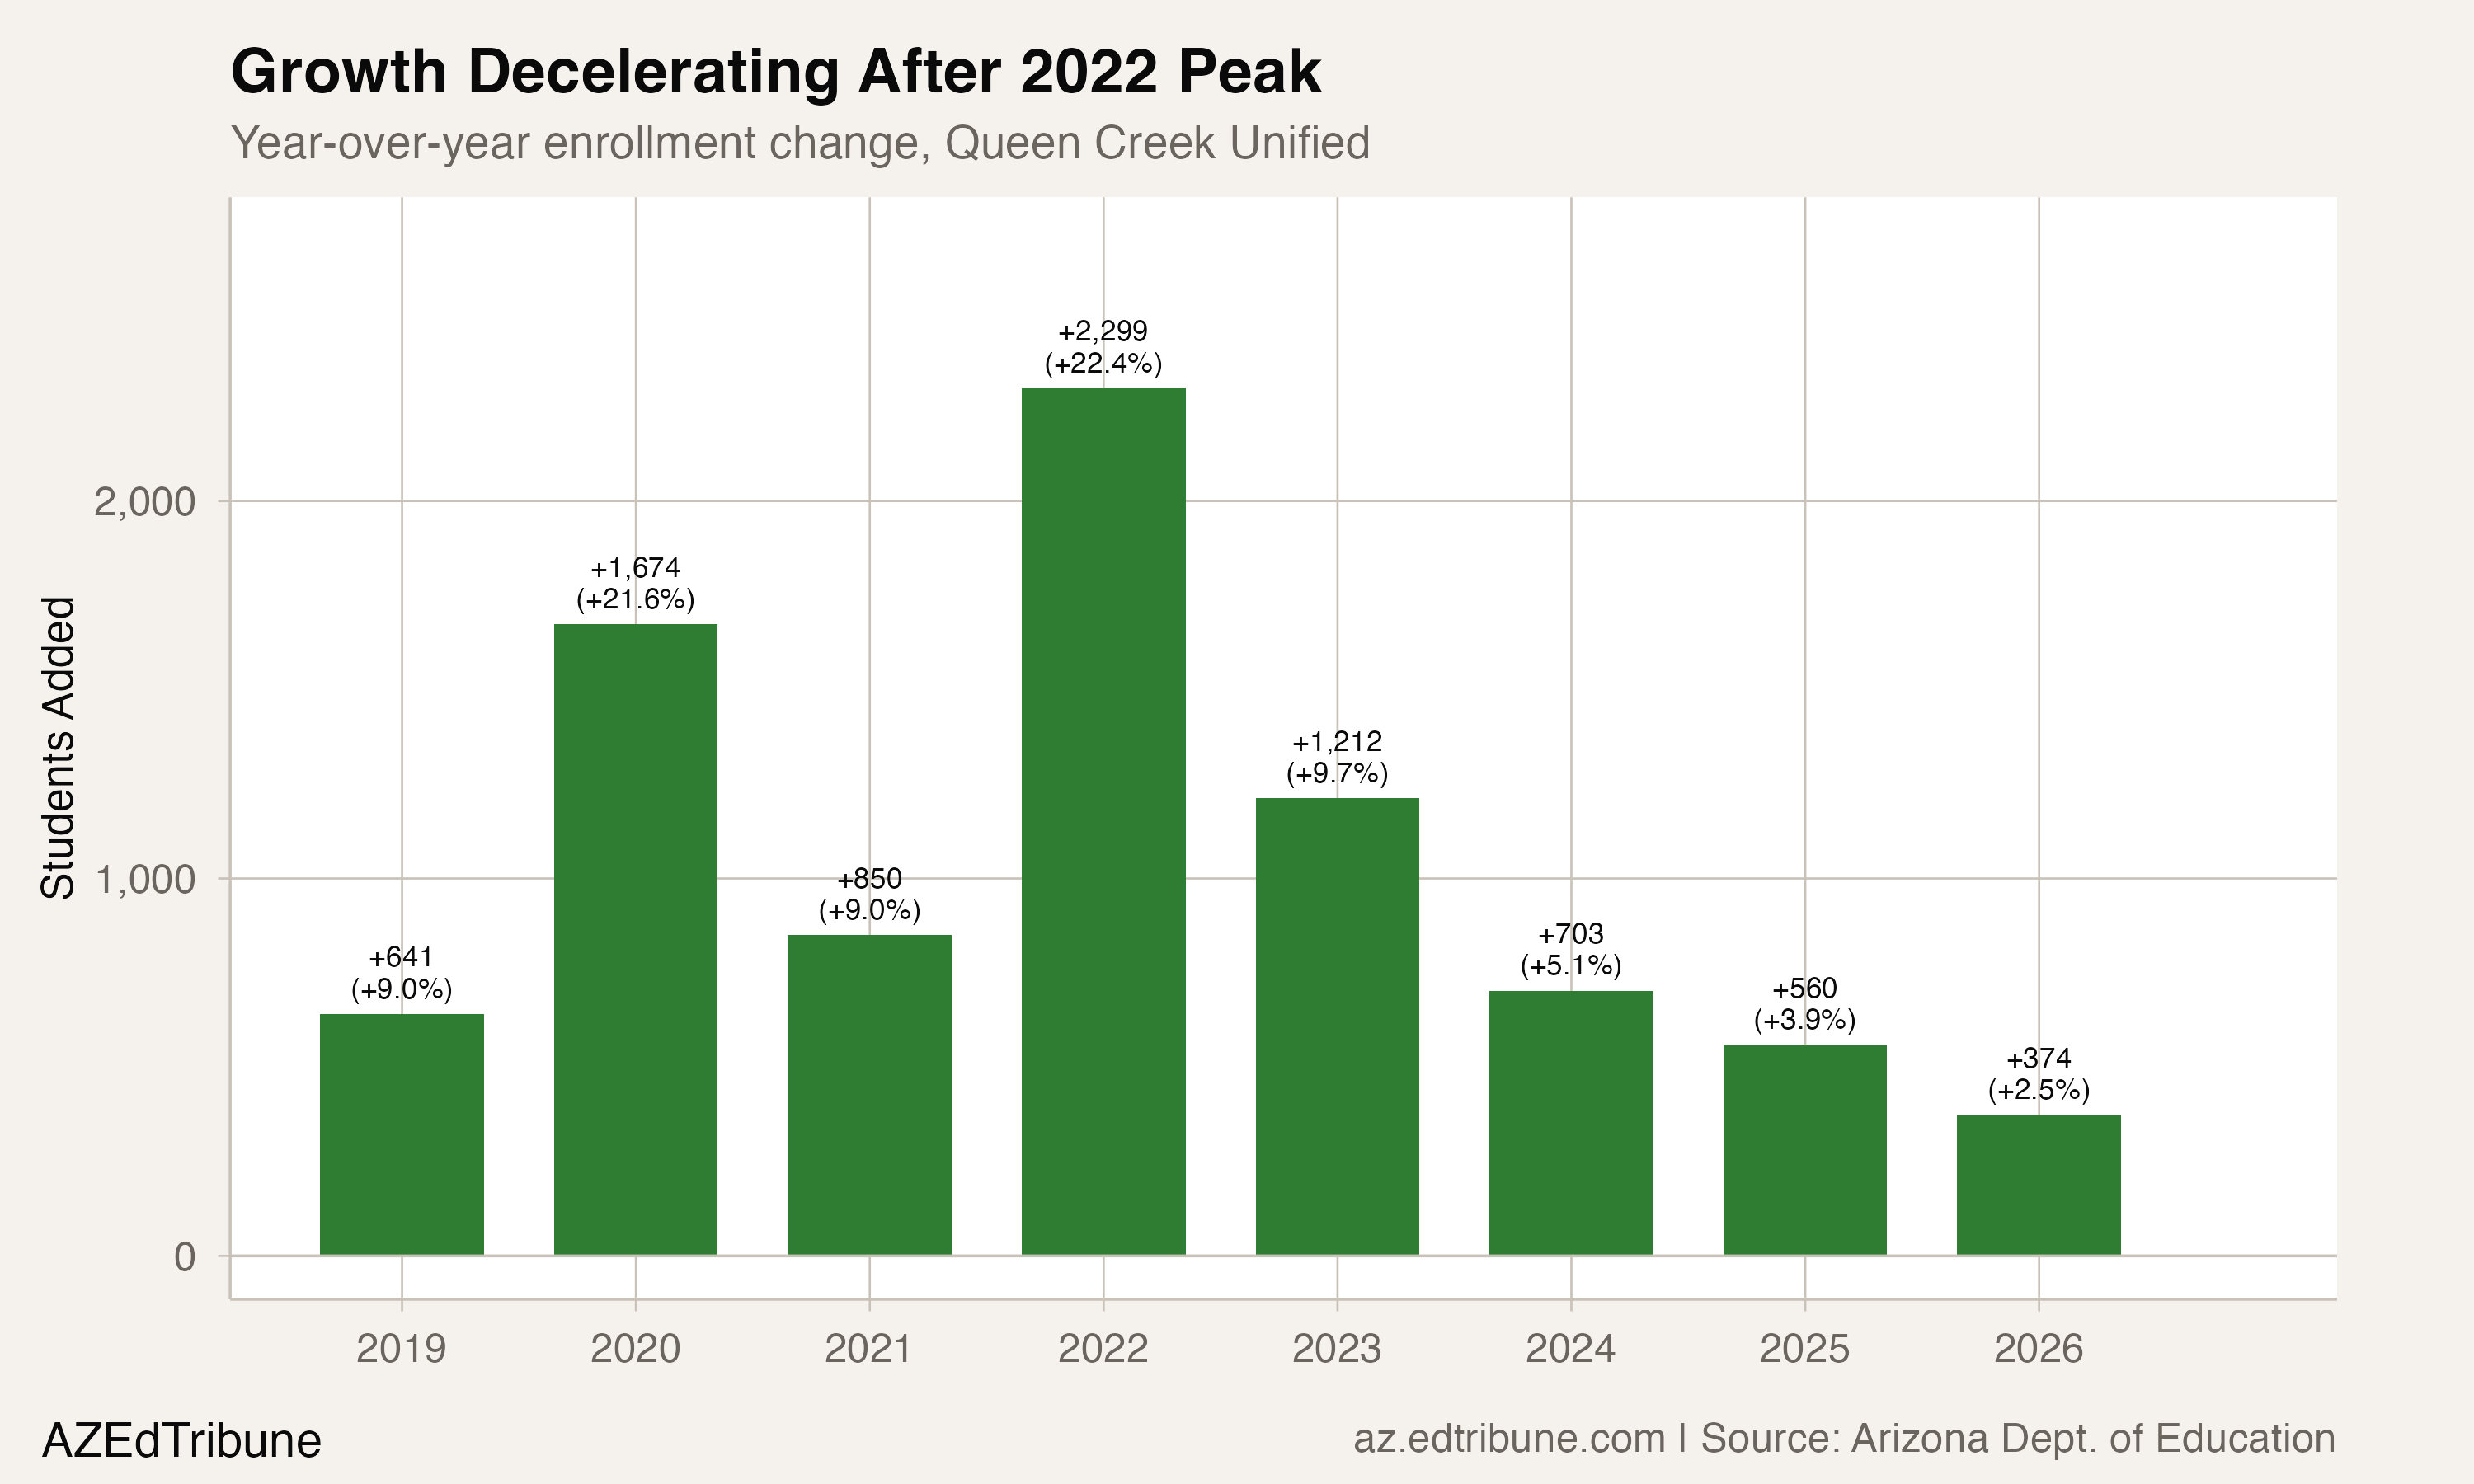
The growth rate has dropped from 22.4% to 2.5% in four years. This does not mean the district is approaching decline. It means the explosive phase driven by greenfield homebuilding is winding down. Eastmark, the largest feeder development, has sold its final new home. Future growth will depend on resale turnover, remaining undeveloped parcels, and whether new master-planned communities break ground south of the town's current footprint.
The district's bond history hints at the fiscal challenge ahead. Queen Creek voters rejected bond proposals in three consecutive November elections before approving the M&O override in 2024. A $198 million bond proposal for new schools, expansions, and infrastructure remains on the district's wish list, but the pattern of bond failures suggests voters are wary of the property tax increases that come with rapid growth.
30 Points Whiter Than the State
Queen Creek's student body looks nothing like Arizona's. In 2025-26, 61.9% of Queen Creek students are white, compared to 32.3% statewide, a gap of 29.6 percentage points. The district's Hispanic share is 25.8%, roughly half the statewide figure of 49.2%. Black students make up 3.3% of enrollment, Asian students 2.3%.
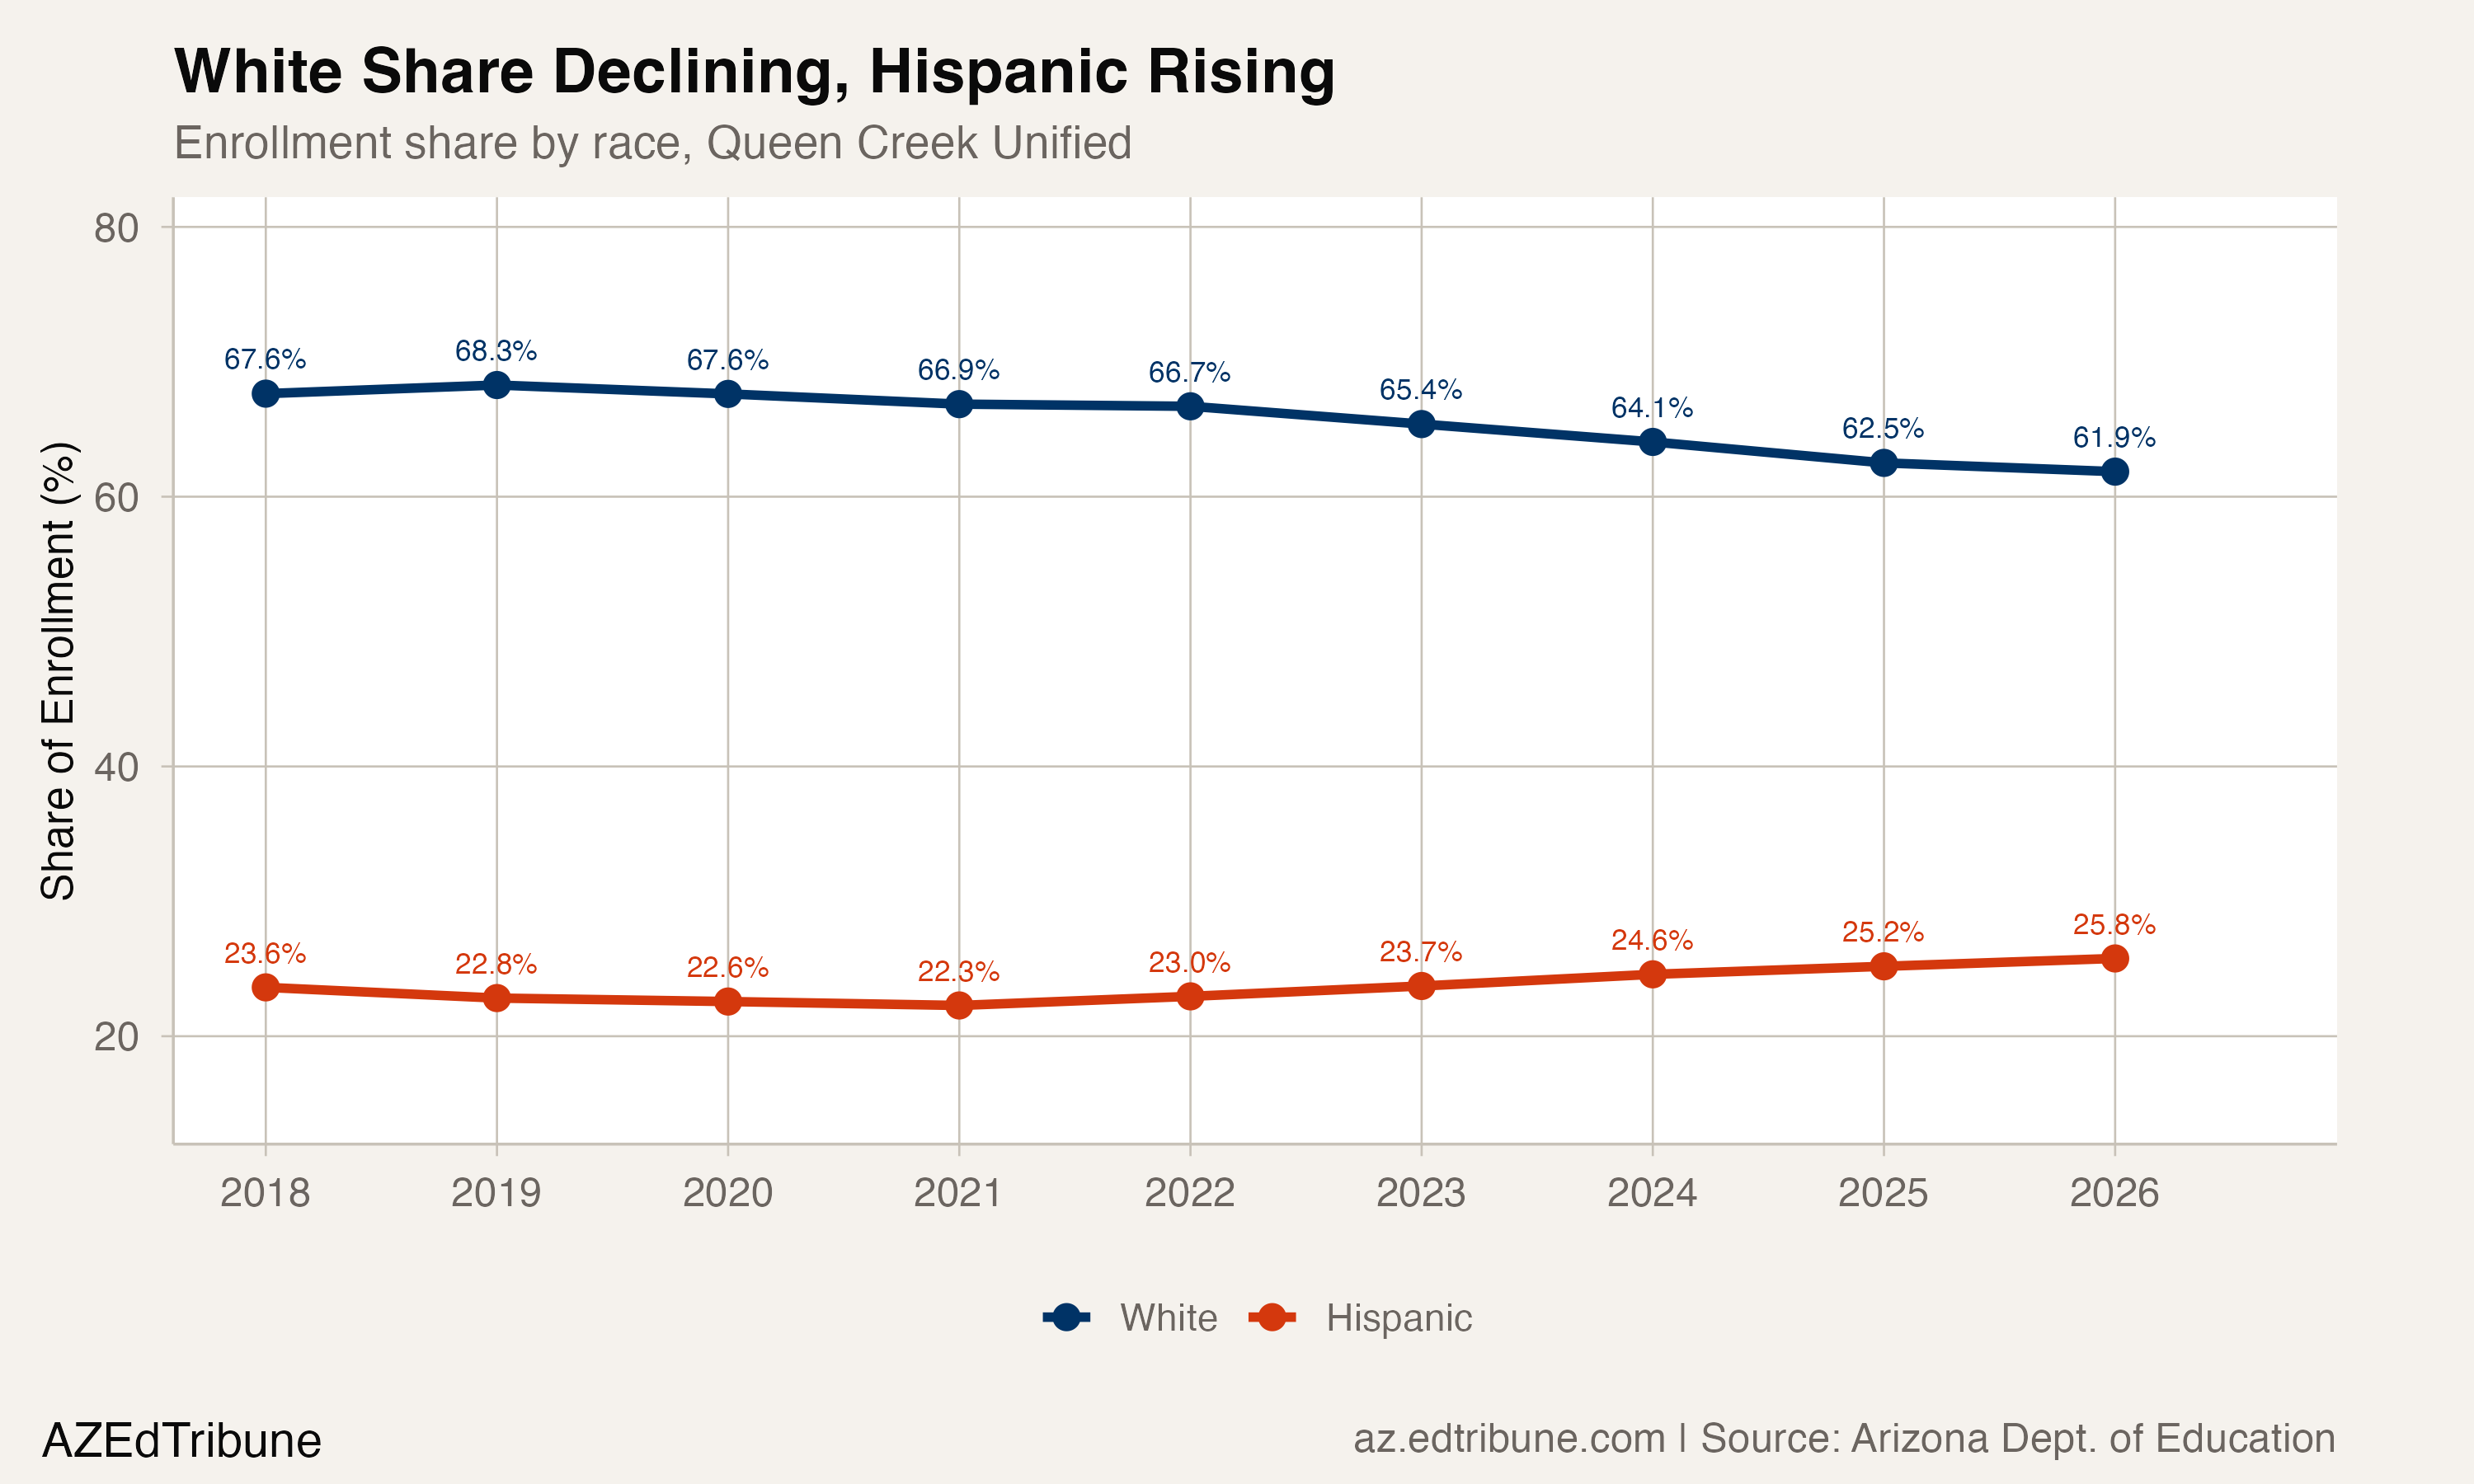
That gap has been remarkably stable. In every year since 2018, Queen Creek's white share has exceeded the state average by between 29.6 and 30.9 percentage points. The district's white share has declined, from 68.3% in 2018-19 to 61.9% in 2025-26, but the state's white share has declined at nearly the same pace, from 37.7% to 32.3%. The demographic gap is not closing.
This pattern is consistent with the demographics of new master-planned community buyers in the Phoenix metro's outer ring. Queen Creek's housing stock is overwhelmingly single-family homes priced above the metro median, which selects for a different income and racial profile than the older, denser neighborhoods closer to the urban core. Just 1.3% of Queen Creek students are classified as English learners, compared to the statewide average that is many times higher. The district's economically disadvantaged share was 19.4% in 2025-26, though that figure has been volatile, jumping from 14.0% to 22.8% between 2021-22 and 2023-24 before dropping back, which likely reflects reporting methodology changes rather than actual shifts in family income.
The Mirror Image
The clearest way to understand Queen Creek's trajectory is to compare it with the inner-ring East Valley districts whose families are, in some cases, the same ones relocating southeast.
Mesa Unified↗ET lost 9,781 students over the same eight-year period, a 15.6% decline. Chandler Unified↗ET lost 4,757, or 10.7%. Gilbert Unified↗ET lost 2,480, or 7.4%. Kyrene Elementary↗ET, which serves parts of Tempe, Chandler, and Phoenix, lost 4,101 students, a 24.5% decline that forced it to close six of its 25 schools to address a projected $6.7 million budget deficit.
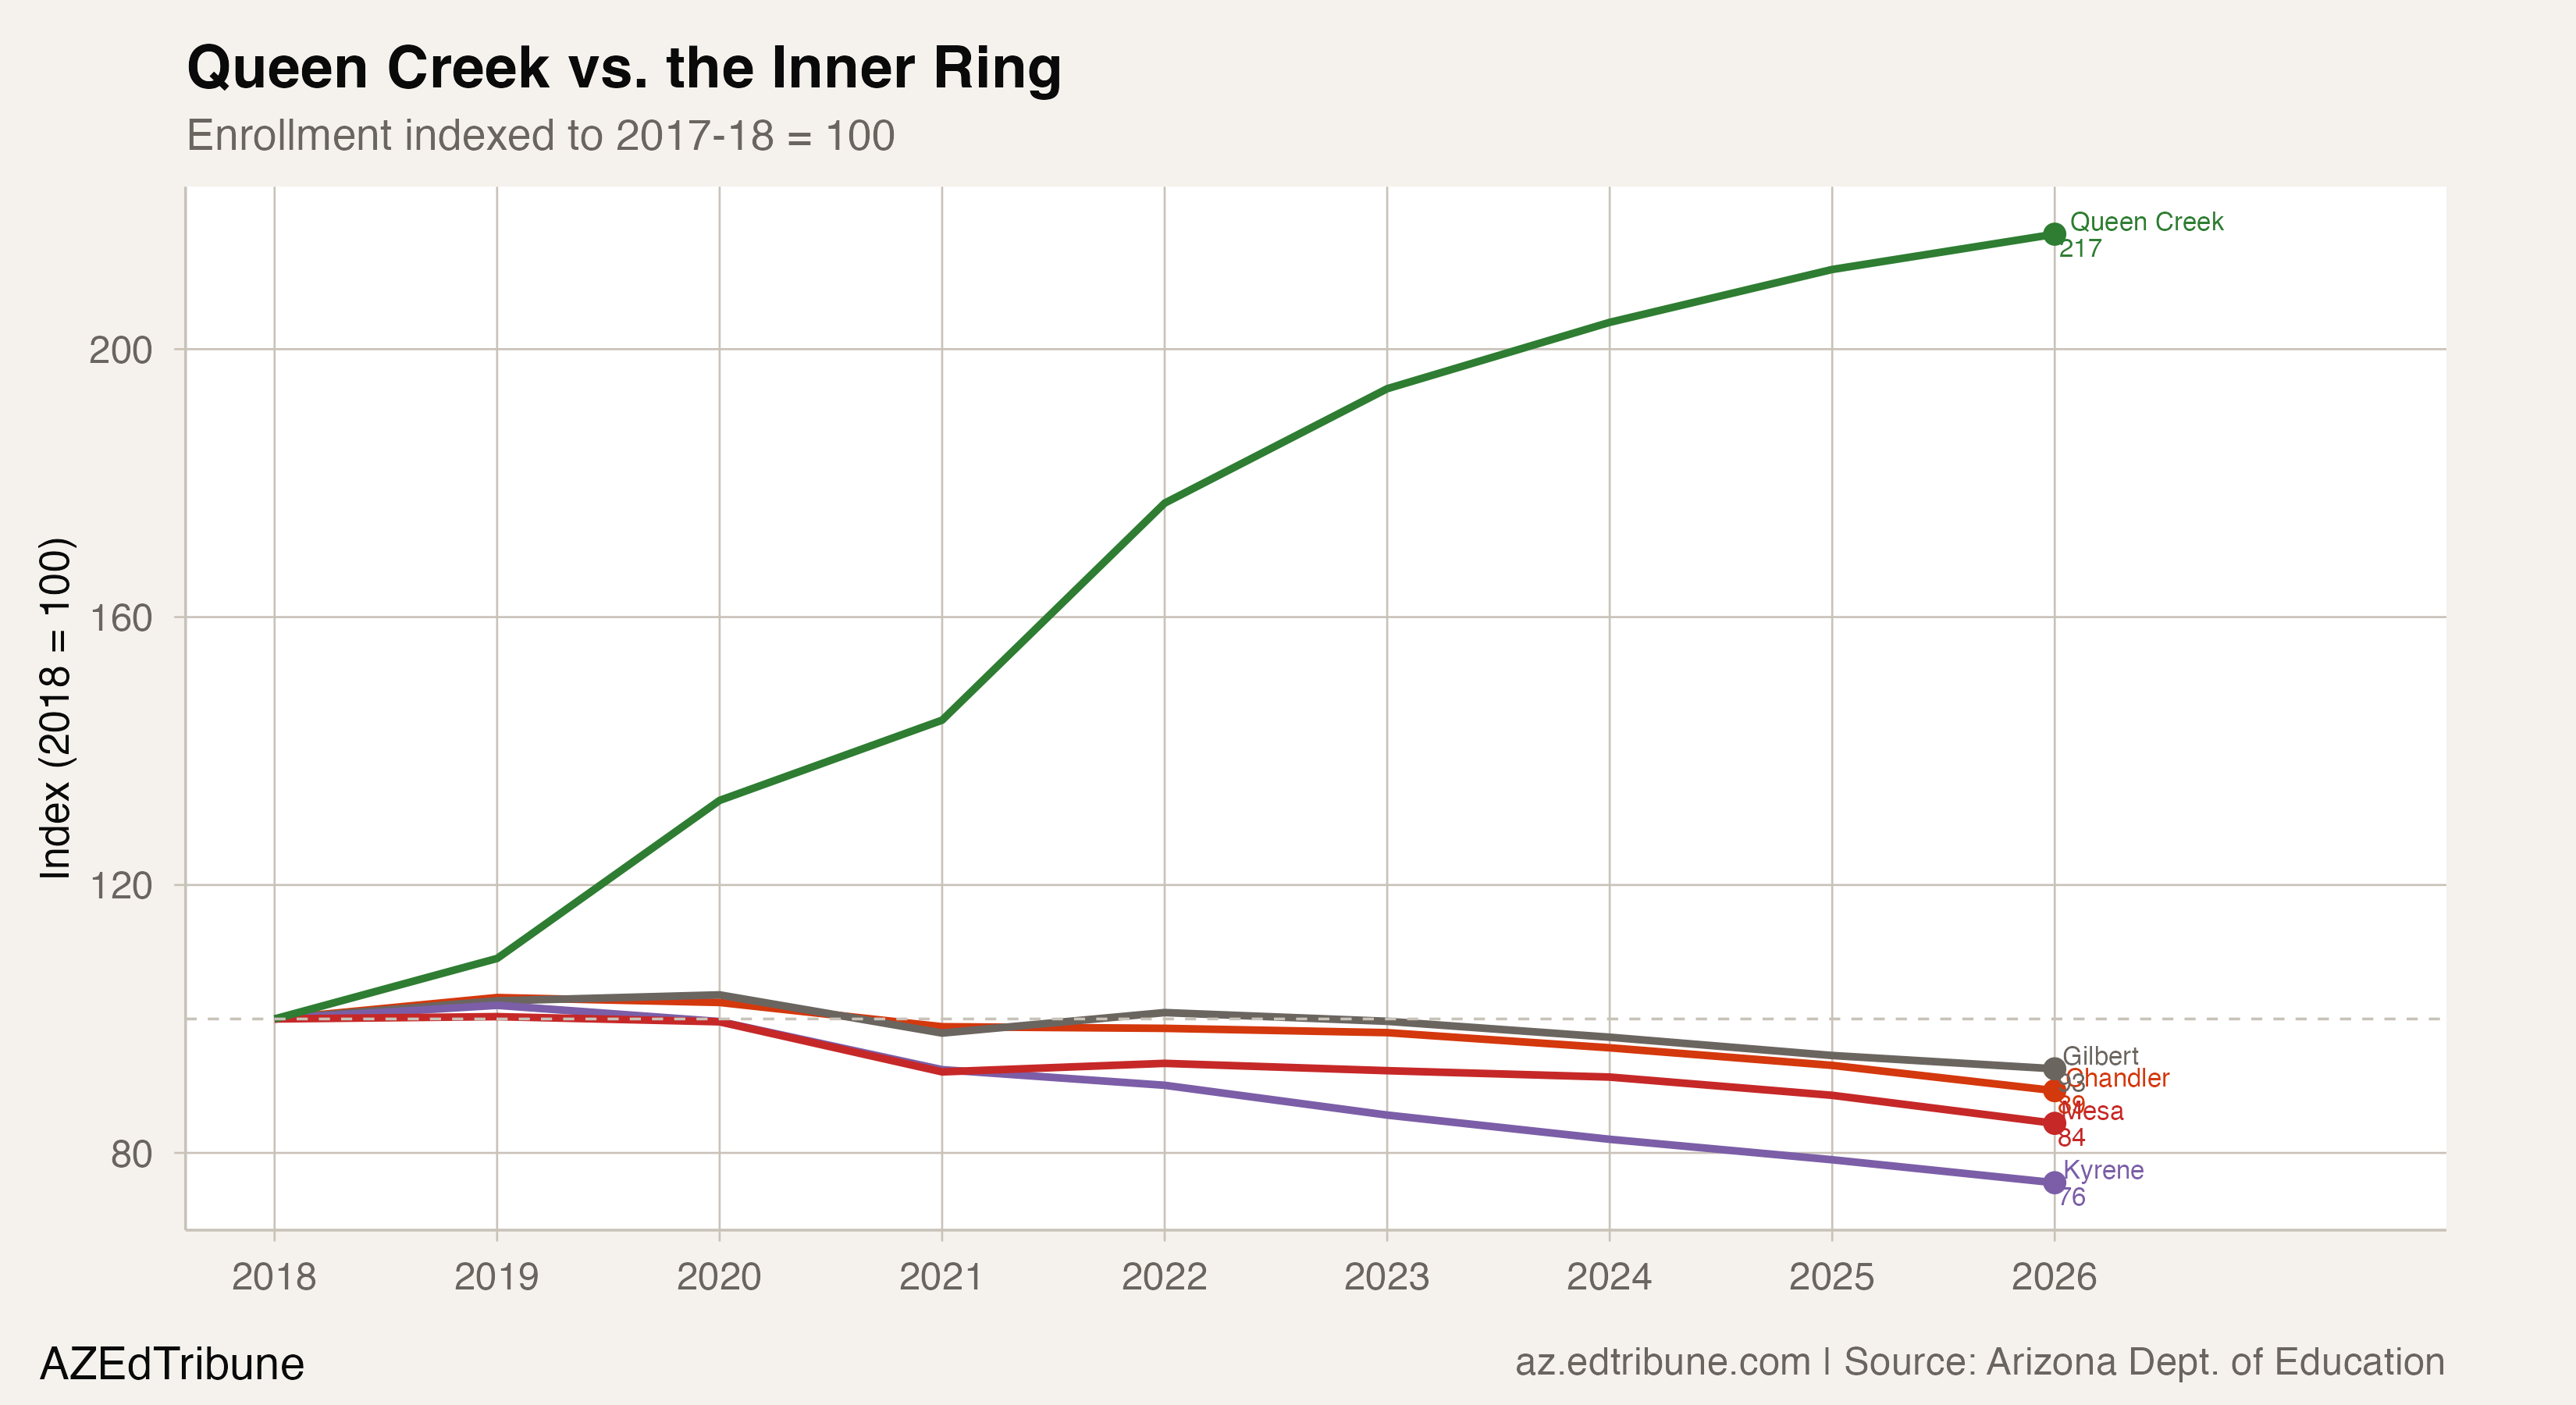
Indexed to 2018, Queen Creek's enrollment stands at 217 while Kyrene's stands at 76. The lines have moved in opposite directions at nearly equal rates. The combined losses from Mesa, Chandler, Gilbert, and Kyrene total 21,119 students since 2018. Queen Creek gained 8,313, roughly 40% of what those four districts lost. The outer ring is absorbing some of the inner ring's departure, but not all of it: charter schools, private schools, Education Savings Accounts, and families leaving the state entirely account for the remainder.
"Enrollment growth has allowed the district to maintain certified teachers in all classrooms and sustain smaller K-8 class sizes." -- Queen Creek Tribune, 2025
That growth dividend, the ability to hire rather than lay off, to open schools rather than close them, is what separates Queen Creek from nearly every other traditional district in the East Valley. Mesa is demolishing 77 portable classrooms to save $1.1 million annually, with 104 portables slated for removal by 2027. Kyrene's closure plan will save an estimated $5.8 million annually. Queen Creek, meanwhile, opened a new elementary school.
Not Alone on the Fringe
Queen Creek is the outer ring's largest growth story, but not its only one. Saddle Mountain Unified↗ET, further west in the Buckeye corridor, grew 97.5% over the same period, from 1,630 to 3,219 students. Maricopa Unified↗ET grew 43.3%, adding 2,884 students. Agua Fria Union High School District↗ET grew 31.9%. The entire western and southern fringe of the Phoenix metro has absorbed students that the inner ring has lost.
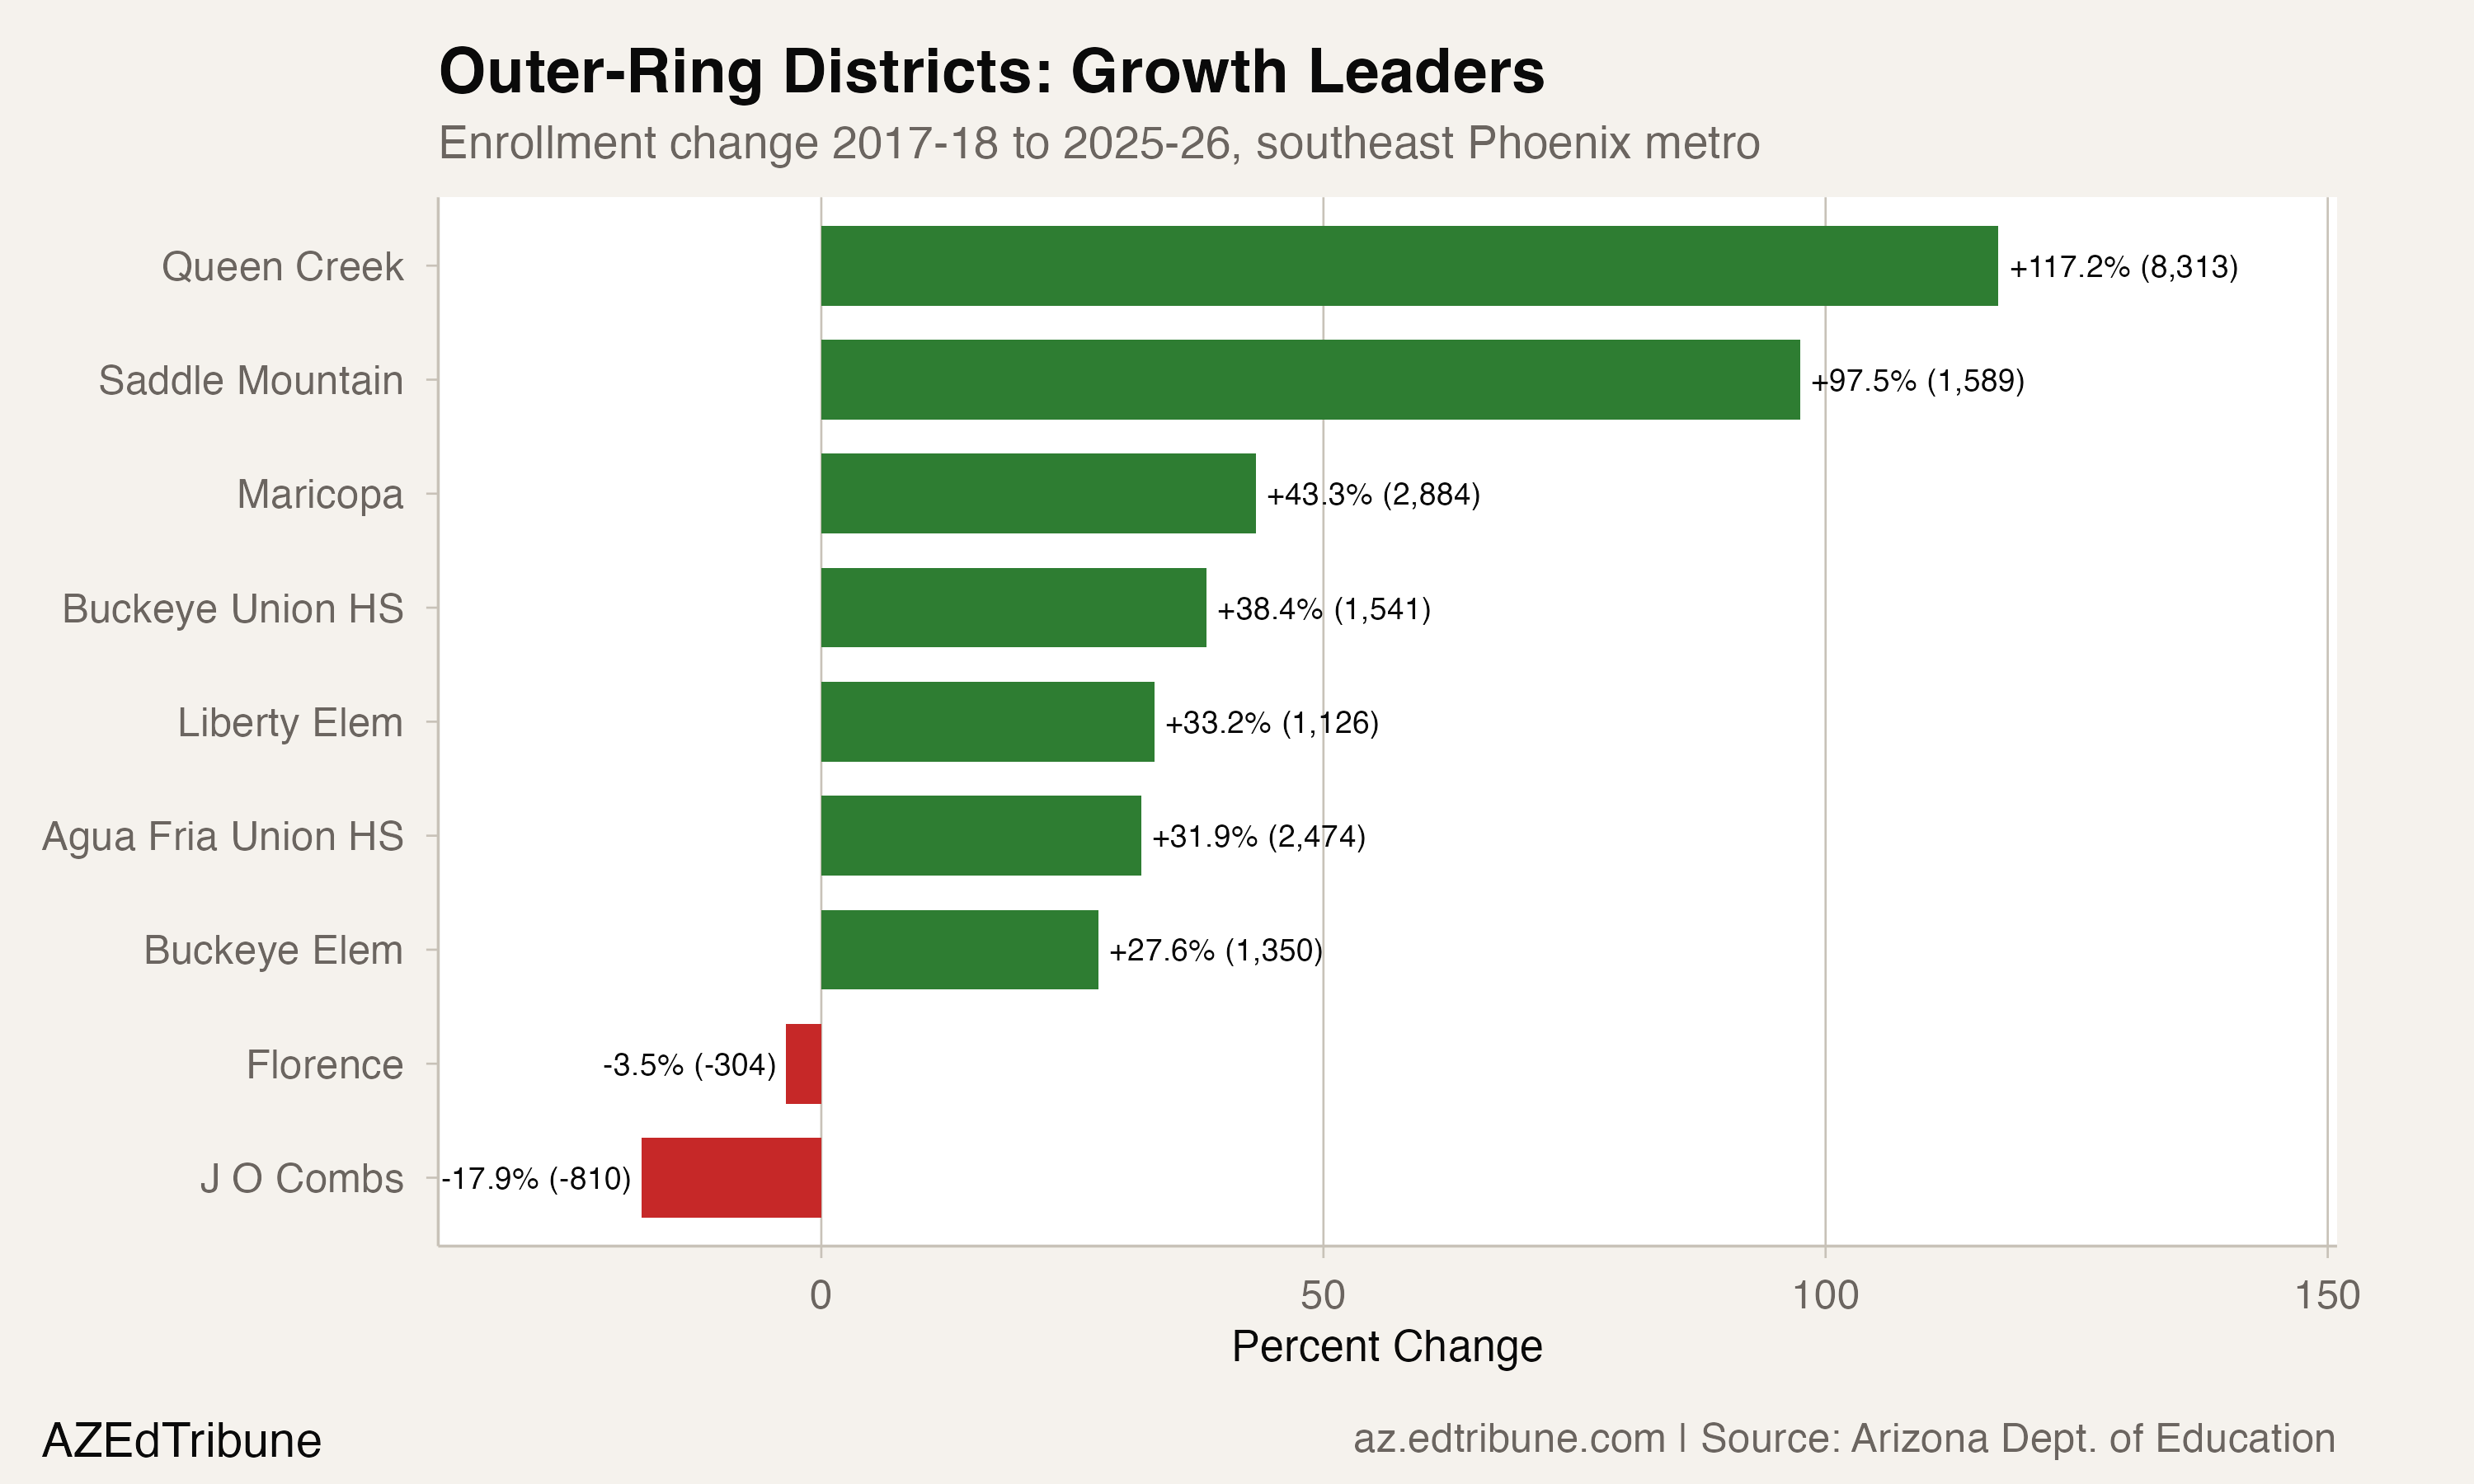
Not every outer-ring district has thrived. J O Combs Unified↗ET, which borders Queen Creek to the south, lost 17.9% of its enrollment over the same period. Florence Unified↗ET, further down the US-60 corridor, declined 3.5%. Proximity to new construction does not guarantee growth. District reputation, school quality ratings, and the specific geography of master-planned community boundaries all determine which districts capture the new arrivals.
What the Deceleration Means
Queen Creek's growth rate in 2025-26 (2.5%) is now lower than the town's population growth rate (8.1% in 2024). That divergence, population growing faster than enrollment, is a pattern familiar to maturing suburbs: as the initial family-heavy buyers are succeeded by empty-nesters, retirees, and smaller households, the ratio of students to residents declines even as the town itself continues to grow.
The district's kindergarten enrollment, 916 students in 2025-26, is the number to watch. It represents the youngest cohort entering the system and the best leading indicator of whether growth will continue or plateau. Kindergarten grew 61.6% since 2018, strong by any measure, but less than half the rate of the high school grades that benefited from the initial move-in surge. If kindergarten enrollment flattens or declines while high school cohorts age out, the district's total enrollment could peak within a few years even as Queen Creek's population continues to climb.
For now, Queen Creek remains the rarest thing in Arizona public education: a traditional school district that is building, hiring, and growing. The 374 students it added last year are a reminder that even rare things slow down.
Detailed code that reproduces the analysis and figures in this article is available exclusively to EdTribune subscribers.
Discussion
Sign in to join the discussion.
Loading comments...