Part of the Arizona Enrollment SeriesET. Updated weekly.
Arizona gained 55,505 net domestic migrants in the year ending July 2025. Its public schools lost 25,998 students over the same period. That paradox has a demographic explanation: the people arriving are not the people enrolling.
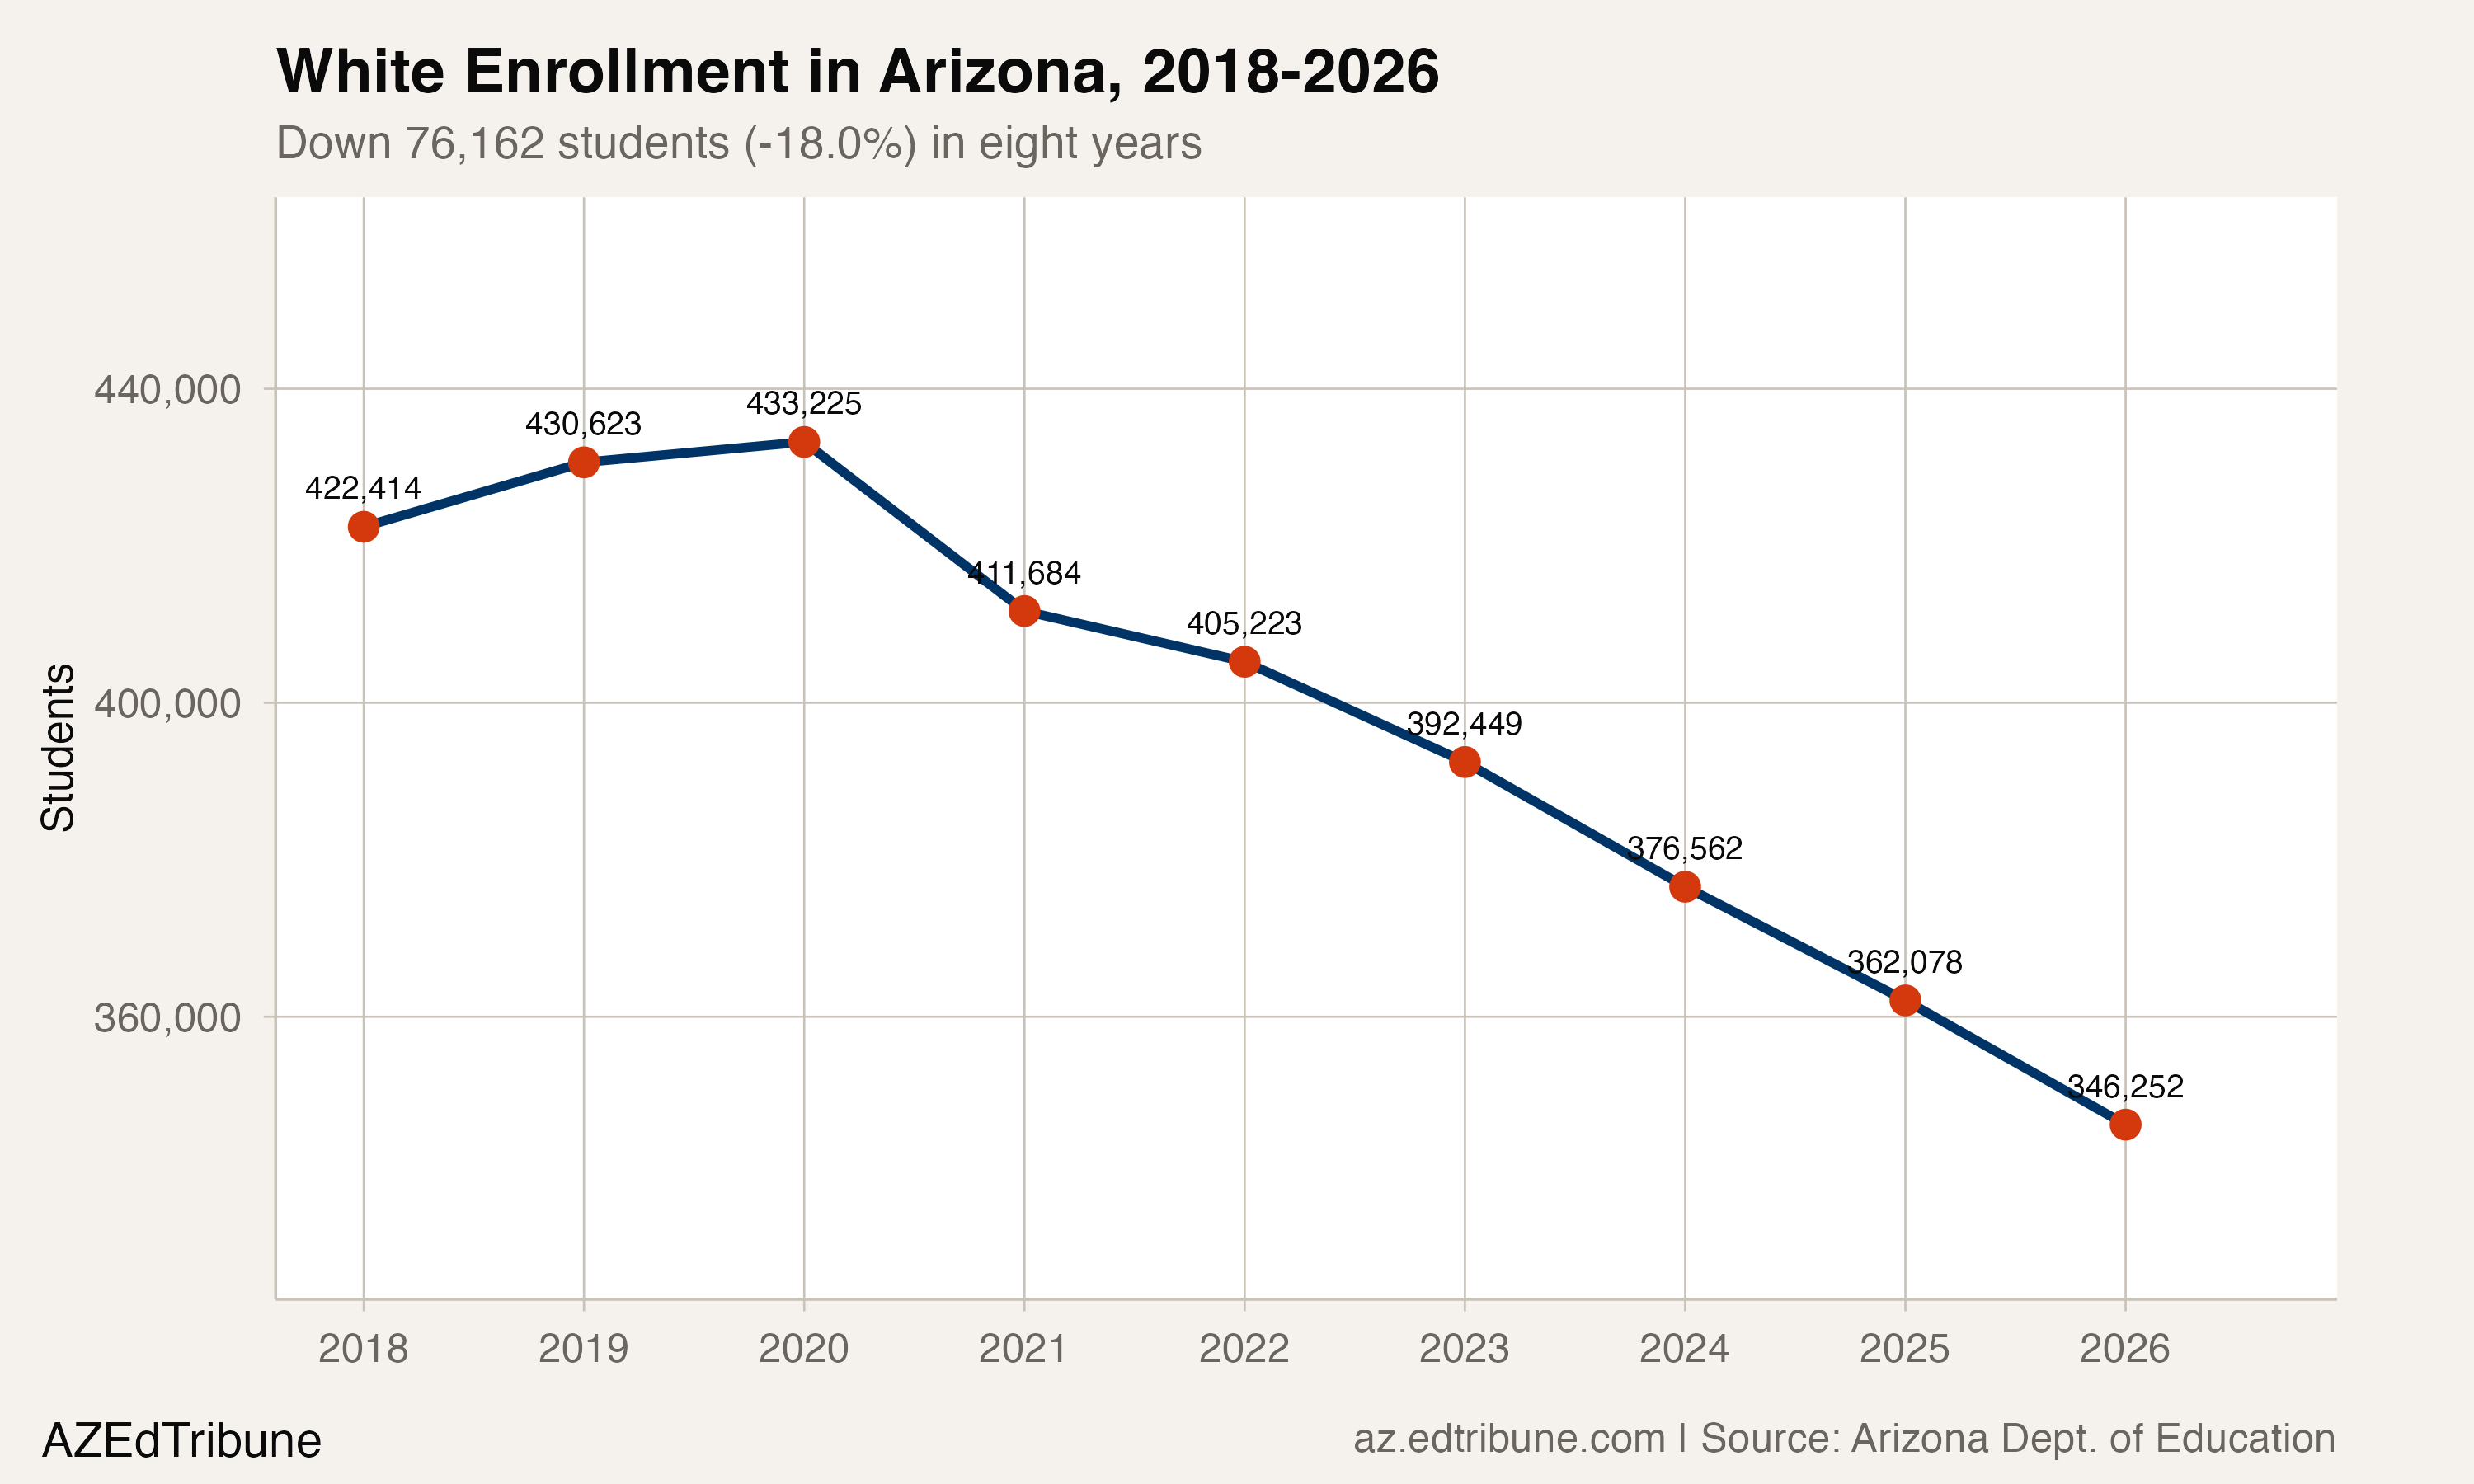
White enrollment in Arizona public schools dropped from 422,414 in 2017-18 to 346,252 in 2025-26, a loss of 76,162 students. That 18.0% decline is five times steeper than the 3.5% drop in total enrollment over the same span. The white exodus from public schools is nearly twice as large as the statewide enrollment decline itself, offset only by modest gains among Hispanic, Black, Asian, and multiracial students.
Six years of acceleration
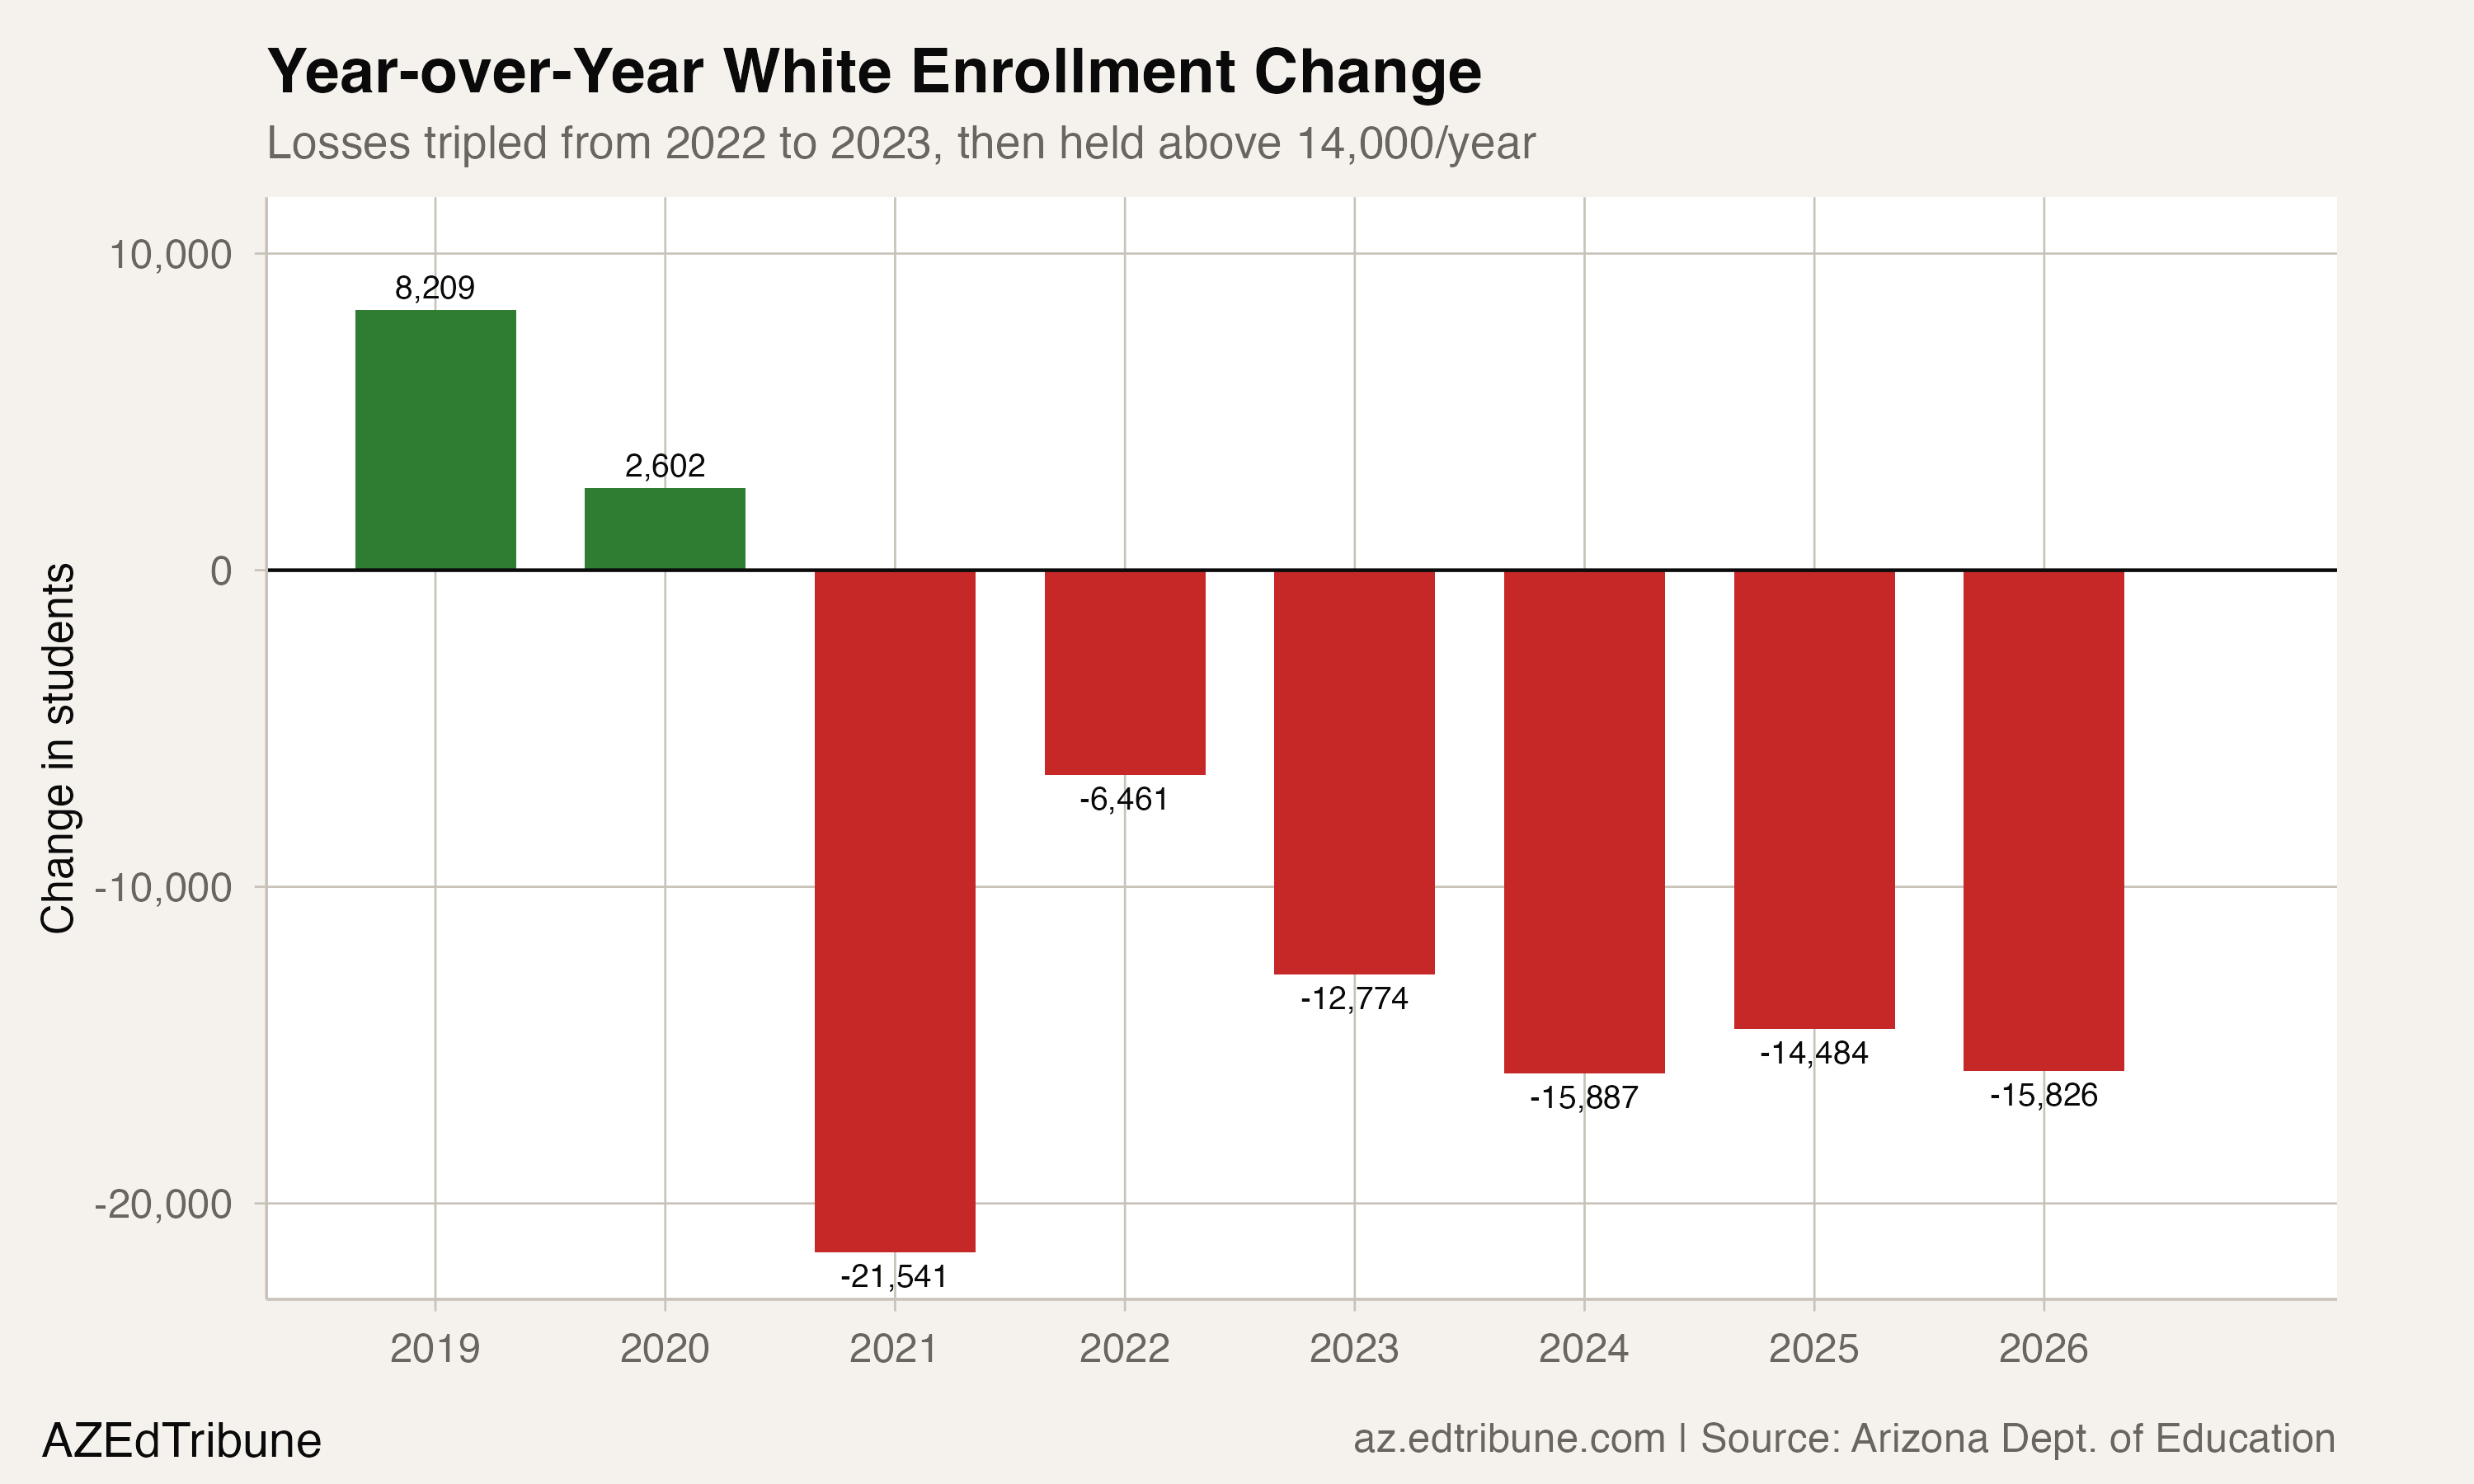
White enrollment actually grew in 2018-19 and 2019-20, adding a combined 10,811 students. Then the pandemic hit. The 2020-21 school year brought a single-year loss of 21,541 white students, a 5.0% drop that dwarfed the 3.0% decline in total enrollment that year.
What followed was not a recovery. After a partial rebound in 2021-22, losses doubled and then tripled, settling into a sustained pace above 12,000 per year:
- 2021-22: -6,461
- 2022-23: -12,774
- 2023-24: -15,887
- 2024-25: -14,484
- 2025-26: -15,826
The three most recent years alone account for 46,197 lost white students, 61% of the entire eight-year total.
Where 37,000 extra losses went
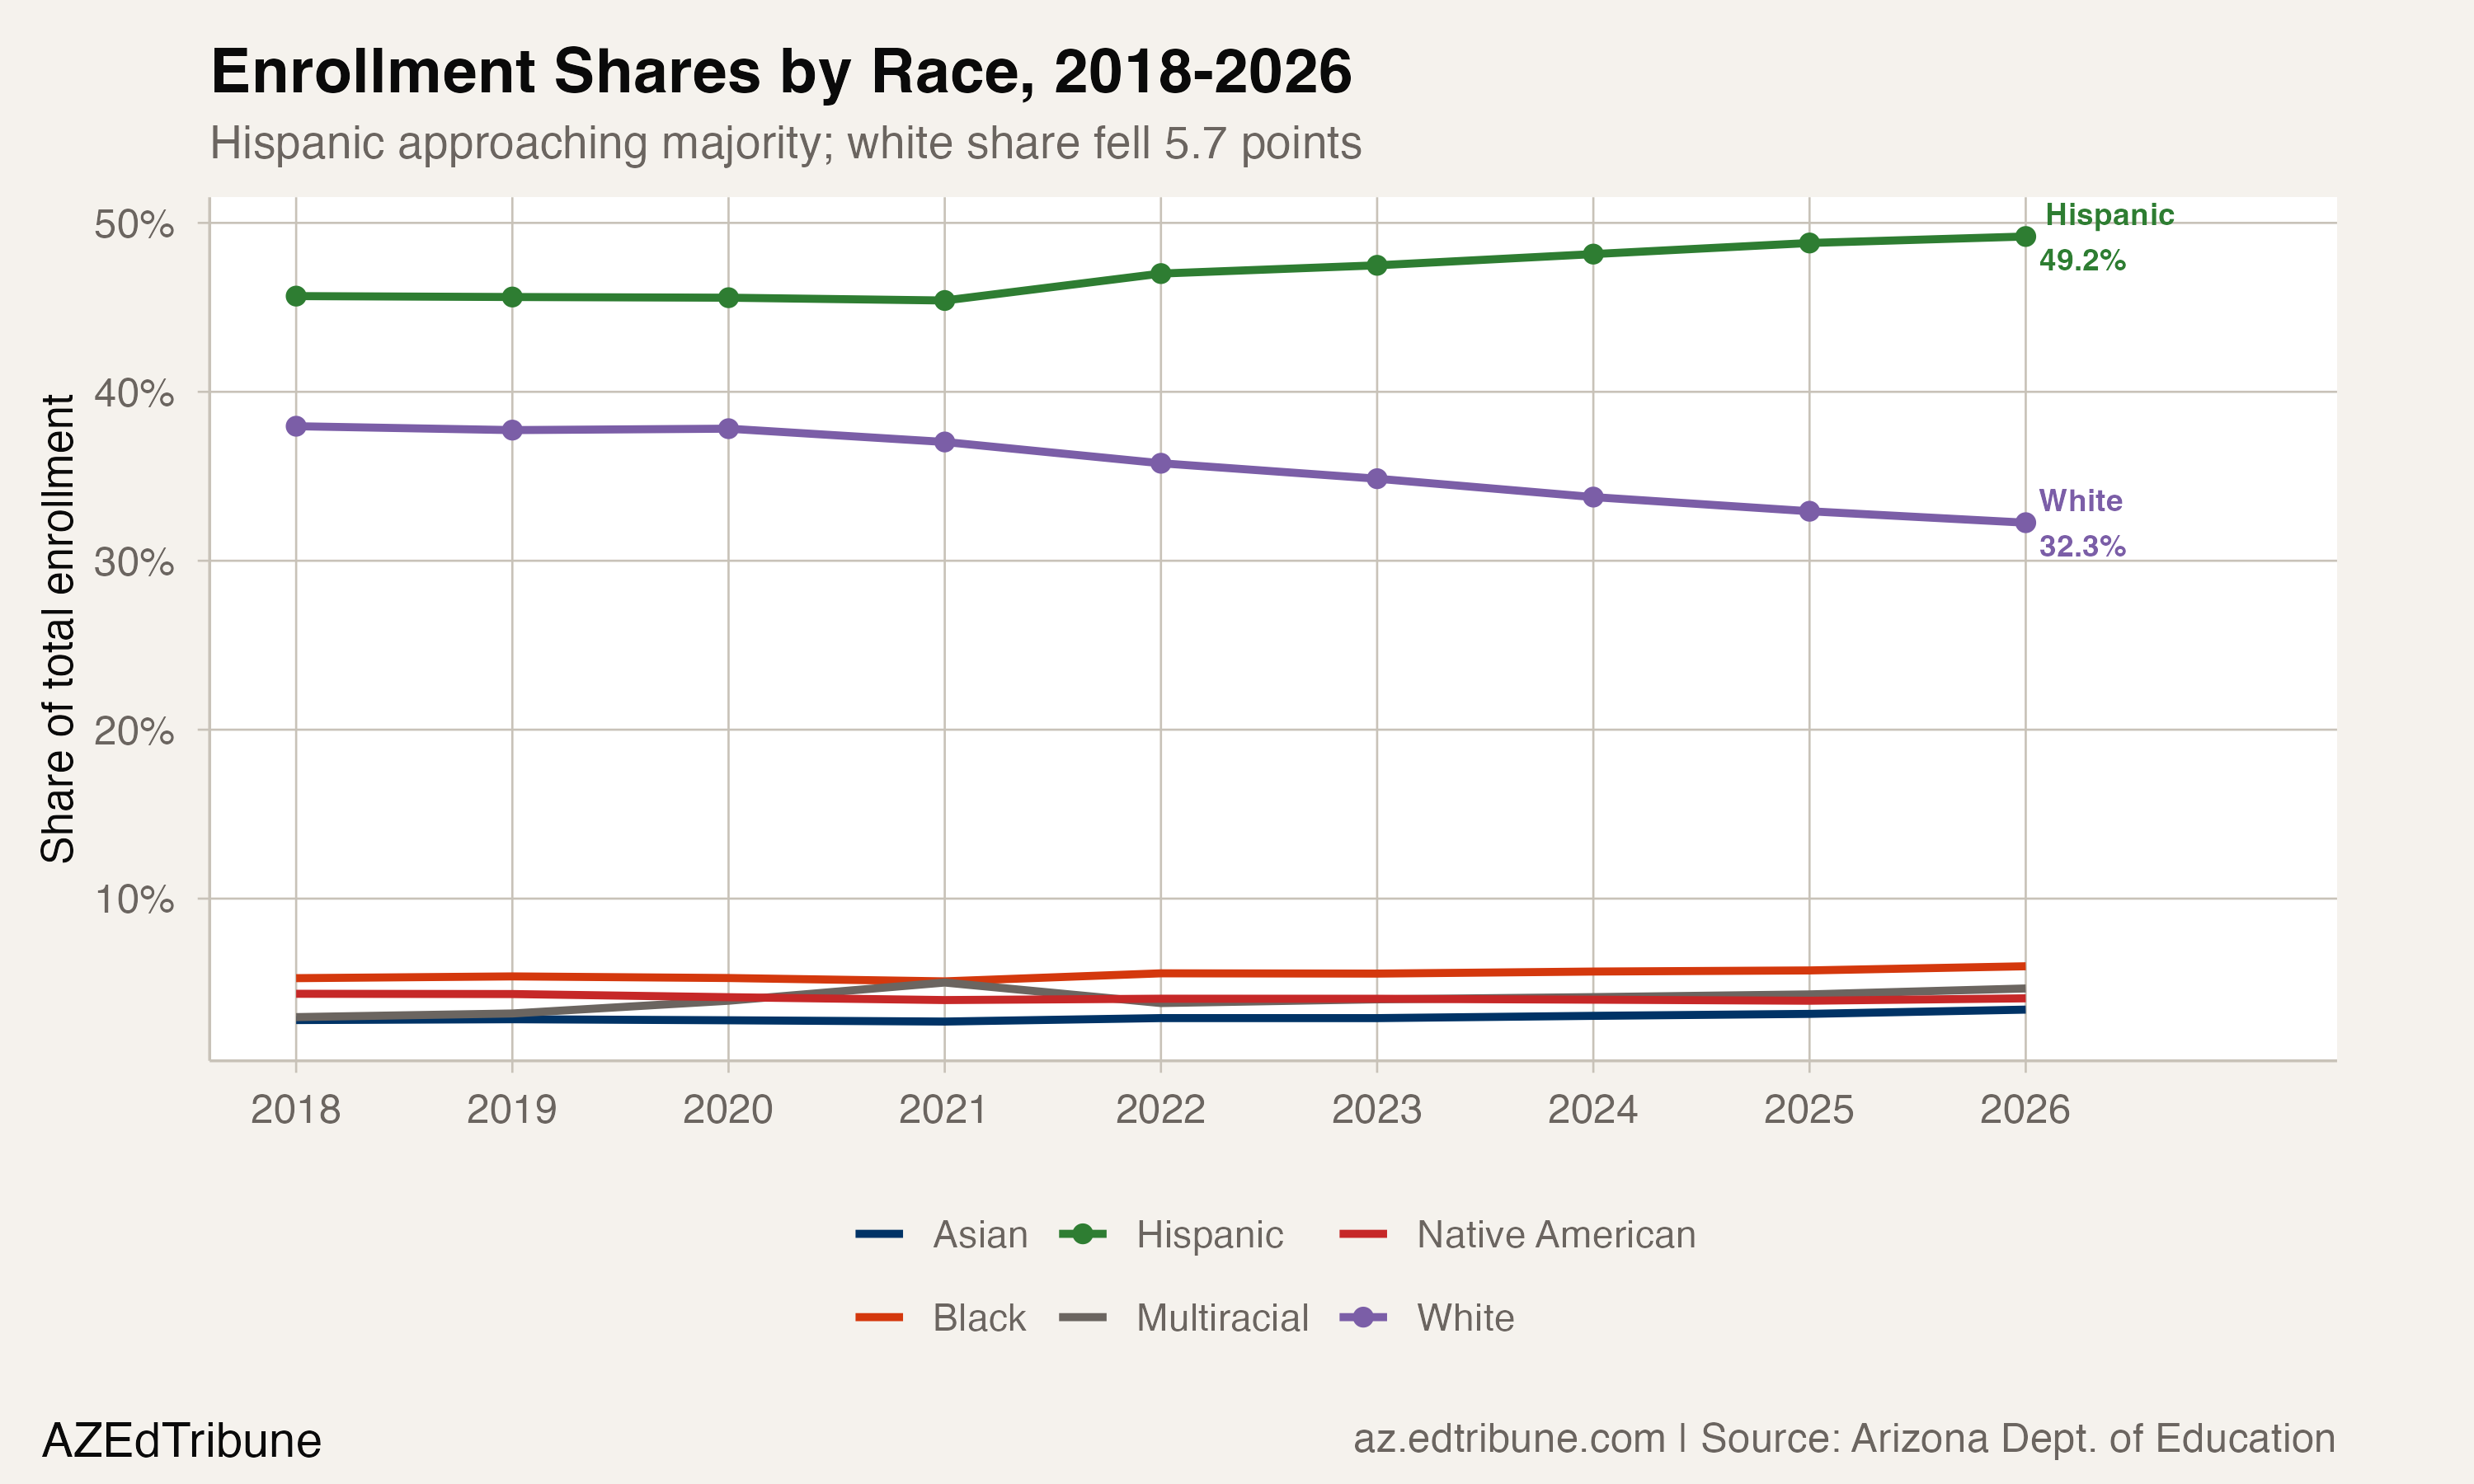
Total enrollment fell by 39,151 students between 2018 and 2026. White enrollment fell by 76,162. The 37,011-student gap means other racial groups collectively added students even as the system shrank. Hispanic enrollment grew by 20,001 (+3.9%), Black enrollment by 5,487 (+9.3%), Asian enrollment by 5,530 (+17.7%), and multiracial enrollment by 17,034 (+51.3%). Native American enrollment declined by 4,590 (-9.4%).
The result is a composition shift that has moved faster than the underlying population. White students made up 38.0% of enrollment in 2018. By 2026, that share had fallen to 32.3%, a 5.7 percentage-point drop. Hispanic students, meanwhile, climbed from 45.7% to 49.2%, approaching an outright majority.
The multiracial caveat
Part of the white decline is a classification shift rather than a real departure. Multiracial enrollment surged 51.3% over the same period, from 33,218 to 50,252 students. Some students who might have been classified as white in an earlier era are now reported as multiracial. The combined white-plus-multiracial share fell from 40.9% in 2018 to 36.9% in 2026, a 4.0-point drop. That is smaller than the 5.7-point drop in the white-only share, but it still represents a real and accelerating decline. Reclassification accounts for at most a fraction of the 76,162-student loss.
The suburban core is bleeding
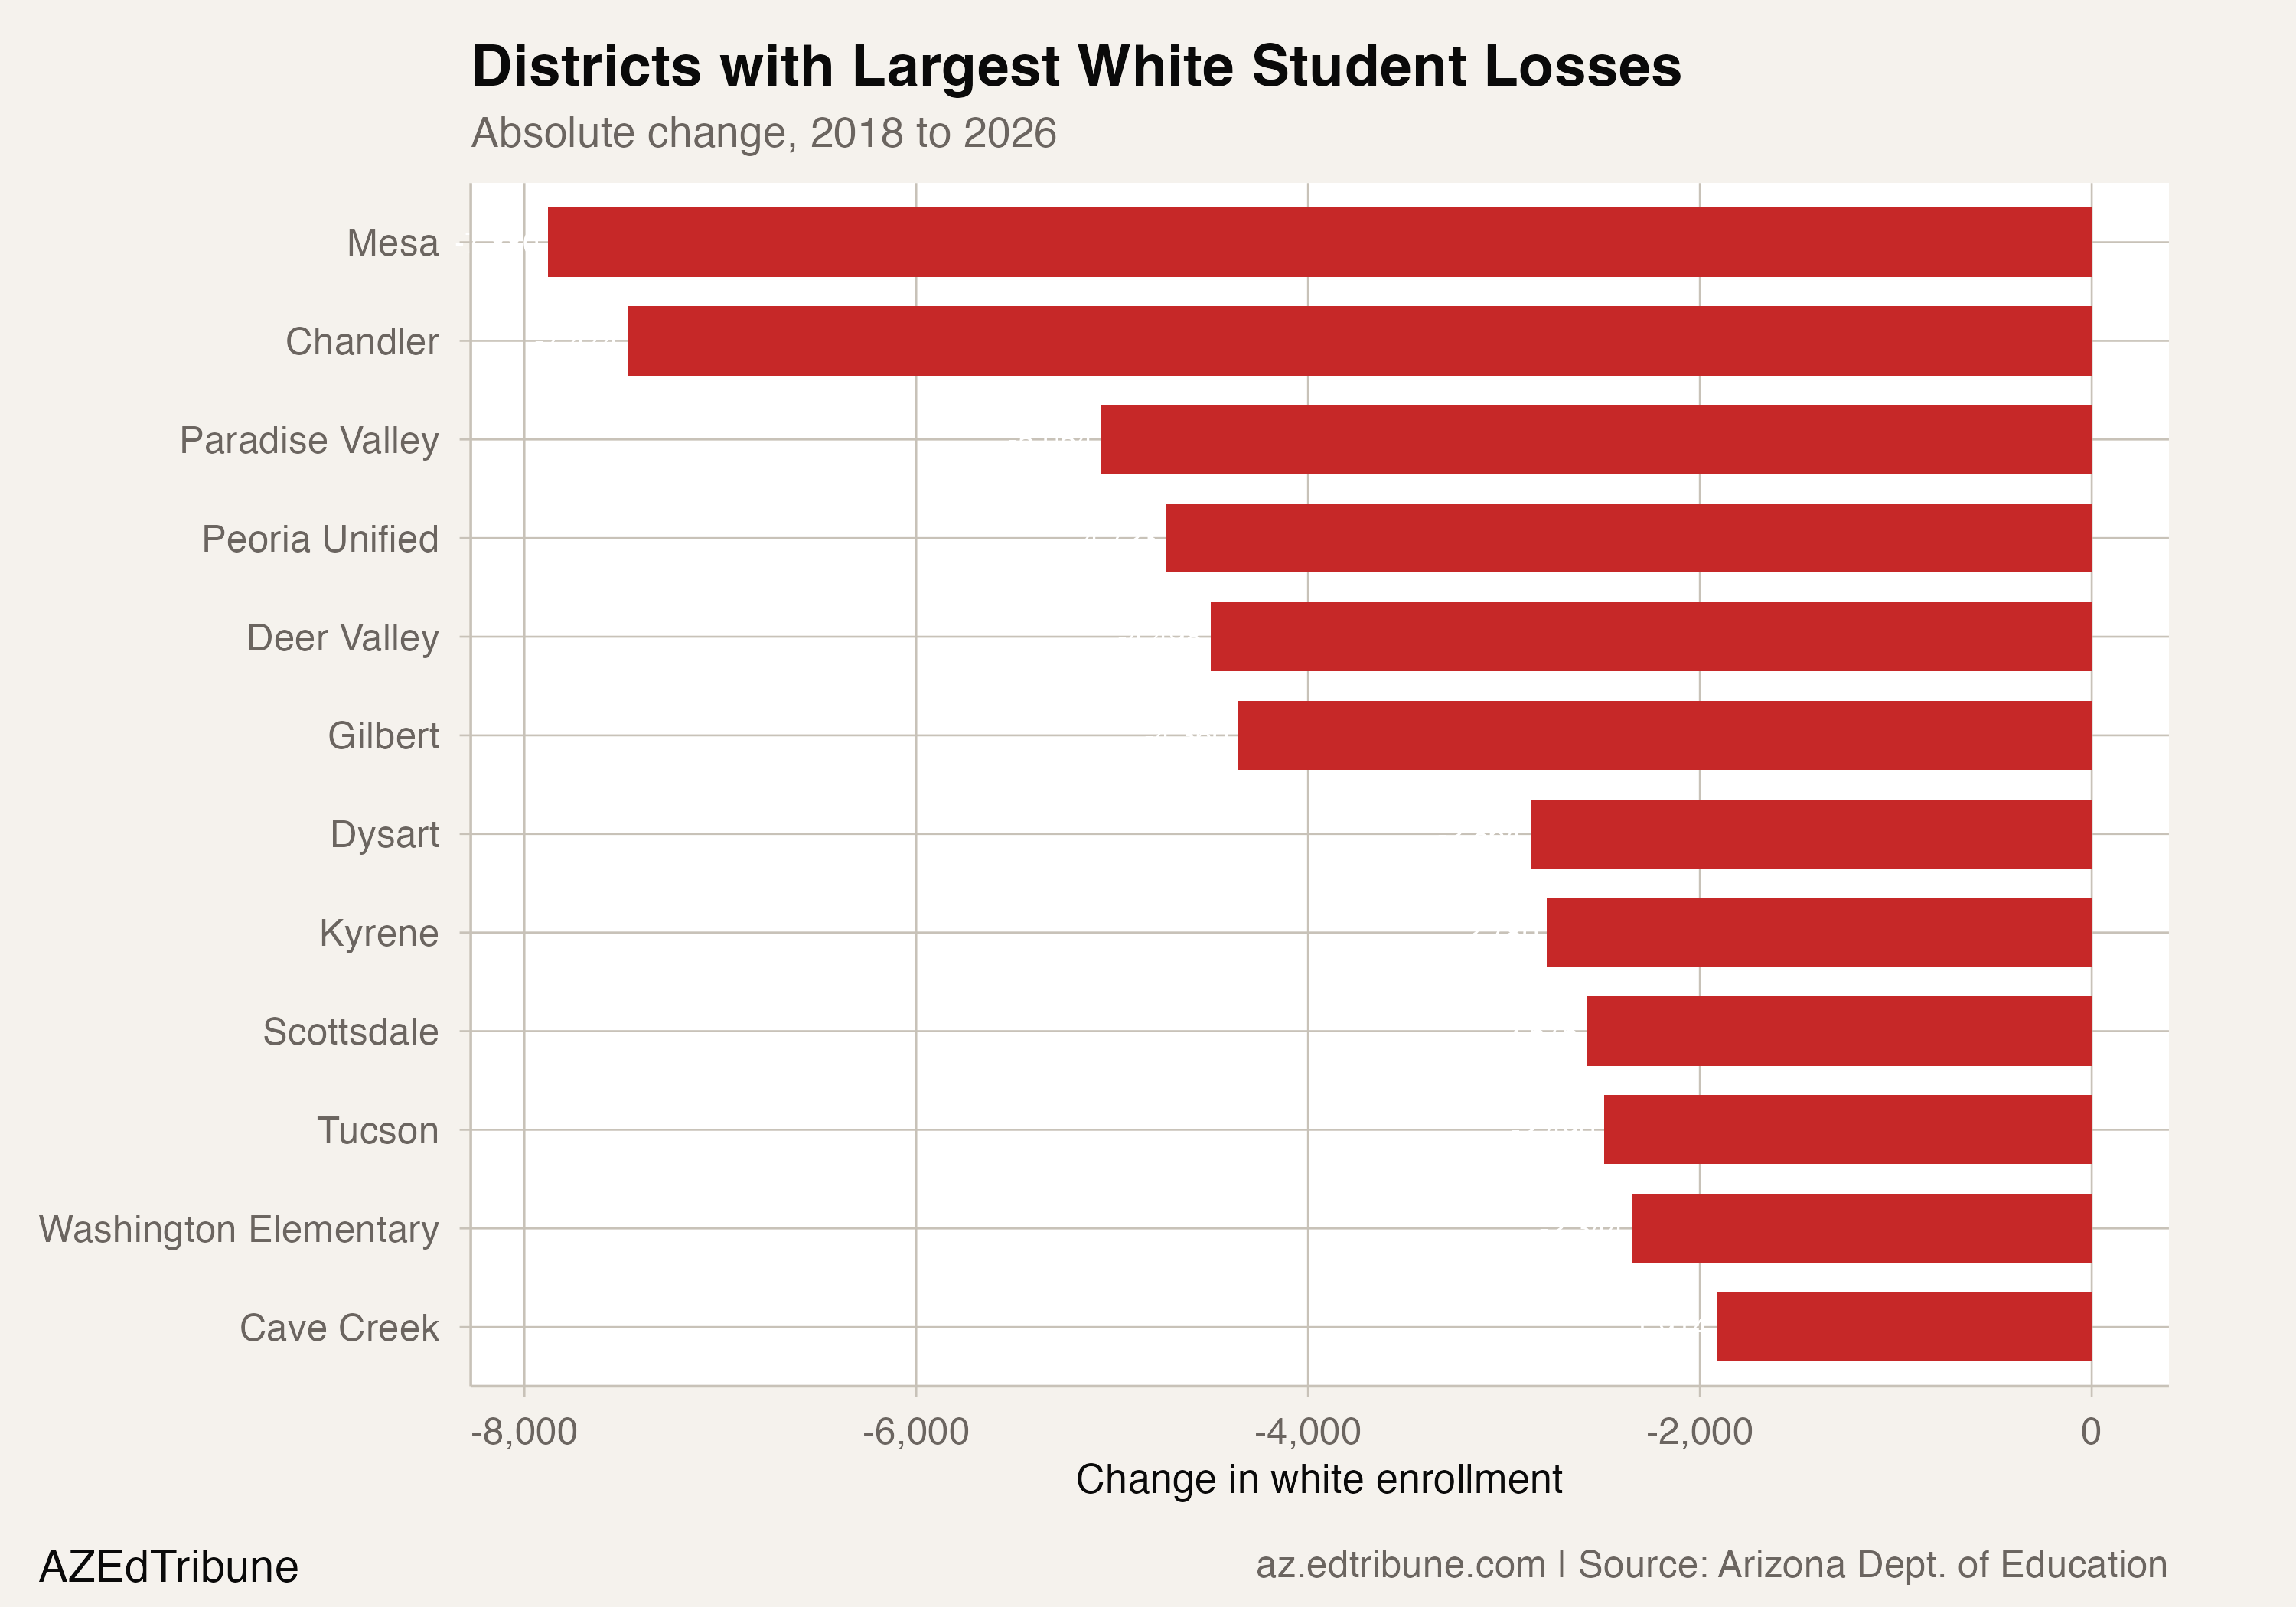
The losses are not evenly distributed. Six suburban Maricopa County districts account for 34,989 of the 76,162 lost white students, nearly half:
| District | White 2018 | White 2026 | Change | Pct |
|---|---|---|---|---|
| Mesa Unified | 27,047 | 19,167 | -7,880 | -29.1% |
| Chandler Unified | 23,915 | 16,441 | -7,474 | -31.3% |
| Paradise Valley Unified | 17,814 | 12,760 | -5,054 | -28.4% |
| Peoria Unified | 19,618 | 14,895 | -4,723 | -24.1% |
| Deer Valley Unified | 22,725 | 18,227 | -4,498 | -19.8% |
| Gilbert Unified | 21,438 | 17,078 | -4,360 | -20.3% |
These are not struggling urban districts. They are the established suburban systems that white families have historically chosen. Mesa, the state's largest district, lost nearly 7,900 white students, a 29.1% decline. Chandler lost 31.3%. Cave Creek, an affluent exurban district, lost 42.1%.
Across all districts, 398 lost white students while only 107 gained them.
Births, vouchers, and charters
The decline has no single cause. Three forces are operating simultaneously, and the data cannot isolate their relative contributions.
Shrinking birth cohorts. Arizona births peaked at 102,530 in 2007 and have hovered near 78,000 annually since 2019. White births have fallen faster than Hispanic births: between 2013 and 2023, Hispanic birth counts rose 2.5% while other groups declined. Smaller incoming kindergarten classes are now working their way through the system. This is the most structurally certain driver, though it explains only a portion of the pace.
ESA vouchers. Arizona's Empowerment Scholarship Account program expanded to universal eligibility in 2022 and now serves more than 100,000 students at a cost approaching $1 billion per year. A RAND study found that ESA users tend to come from districts with higher incomes and larger white populations. A Brookings analysis found ESA participation rates more than five times higher in the lowest-poverty zip codes than in the highest-poverty ones. The program does not publish participant race data, so its direct contribution to white enrollment decline cannot be measured. But its demographic skew is well documented.
Charter sector growth. Charter enrollment in Arizona grew from roughly 163,000 in 2014-15 to nearly 231,000 by 2024-25, a gain exceeding 67,000 students. Because the state enrollment data includes both district and charter schools, charter growth does not directly explain the decline in the statewide white count. But it does reshape which districts absorb the losses: traditional suburban districts lose white families to both charters and ESAs simultaneously.
The operational toll
"Taking a huge bite out of TUSD and potential revenue that should have come into the district over the last three or four years." -- Superintendent Gabriel Trujillo, Tucson Unified, AZPM, Feb. 2026
The fiscal math is straightforward: Arizona's per-pupil funding follows students. Districts losing white enrollment at 14,000 to 16,000 students per year are losing the equivalent revenue. Paradise Valley Unified closed three schools in 2024 after losing roughly 5,000 total students since 2013. Mesa Unified is removing portable classrooms equivalent to four elementary schools and projects a further drop of 1,800 students as birth rates decline and school choice expands. Kyrene Elementary is closing six schools across two years.
Across the Phoenix metro alone, more than 20 school buildings closed in 2024 and 2025, with more planned.
78 districts flipped
In 2018, 264 of Arizona's 585 districts (45%) had a white student majority. By 2026, that number had fallen to 166 of 617 (27%). Seventy-eight districts that were majority-white in 2018 are no longer.
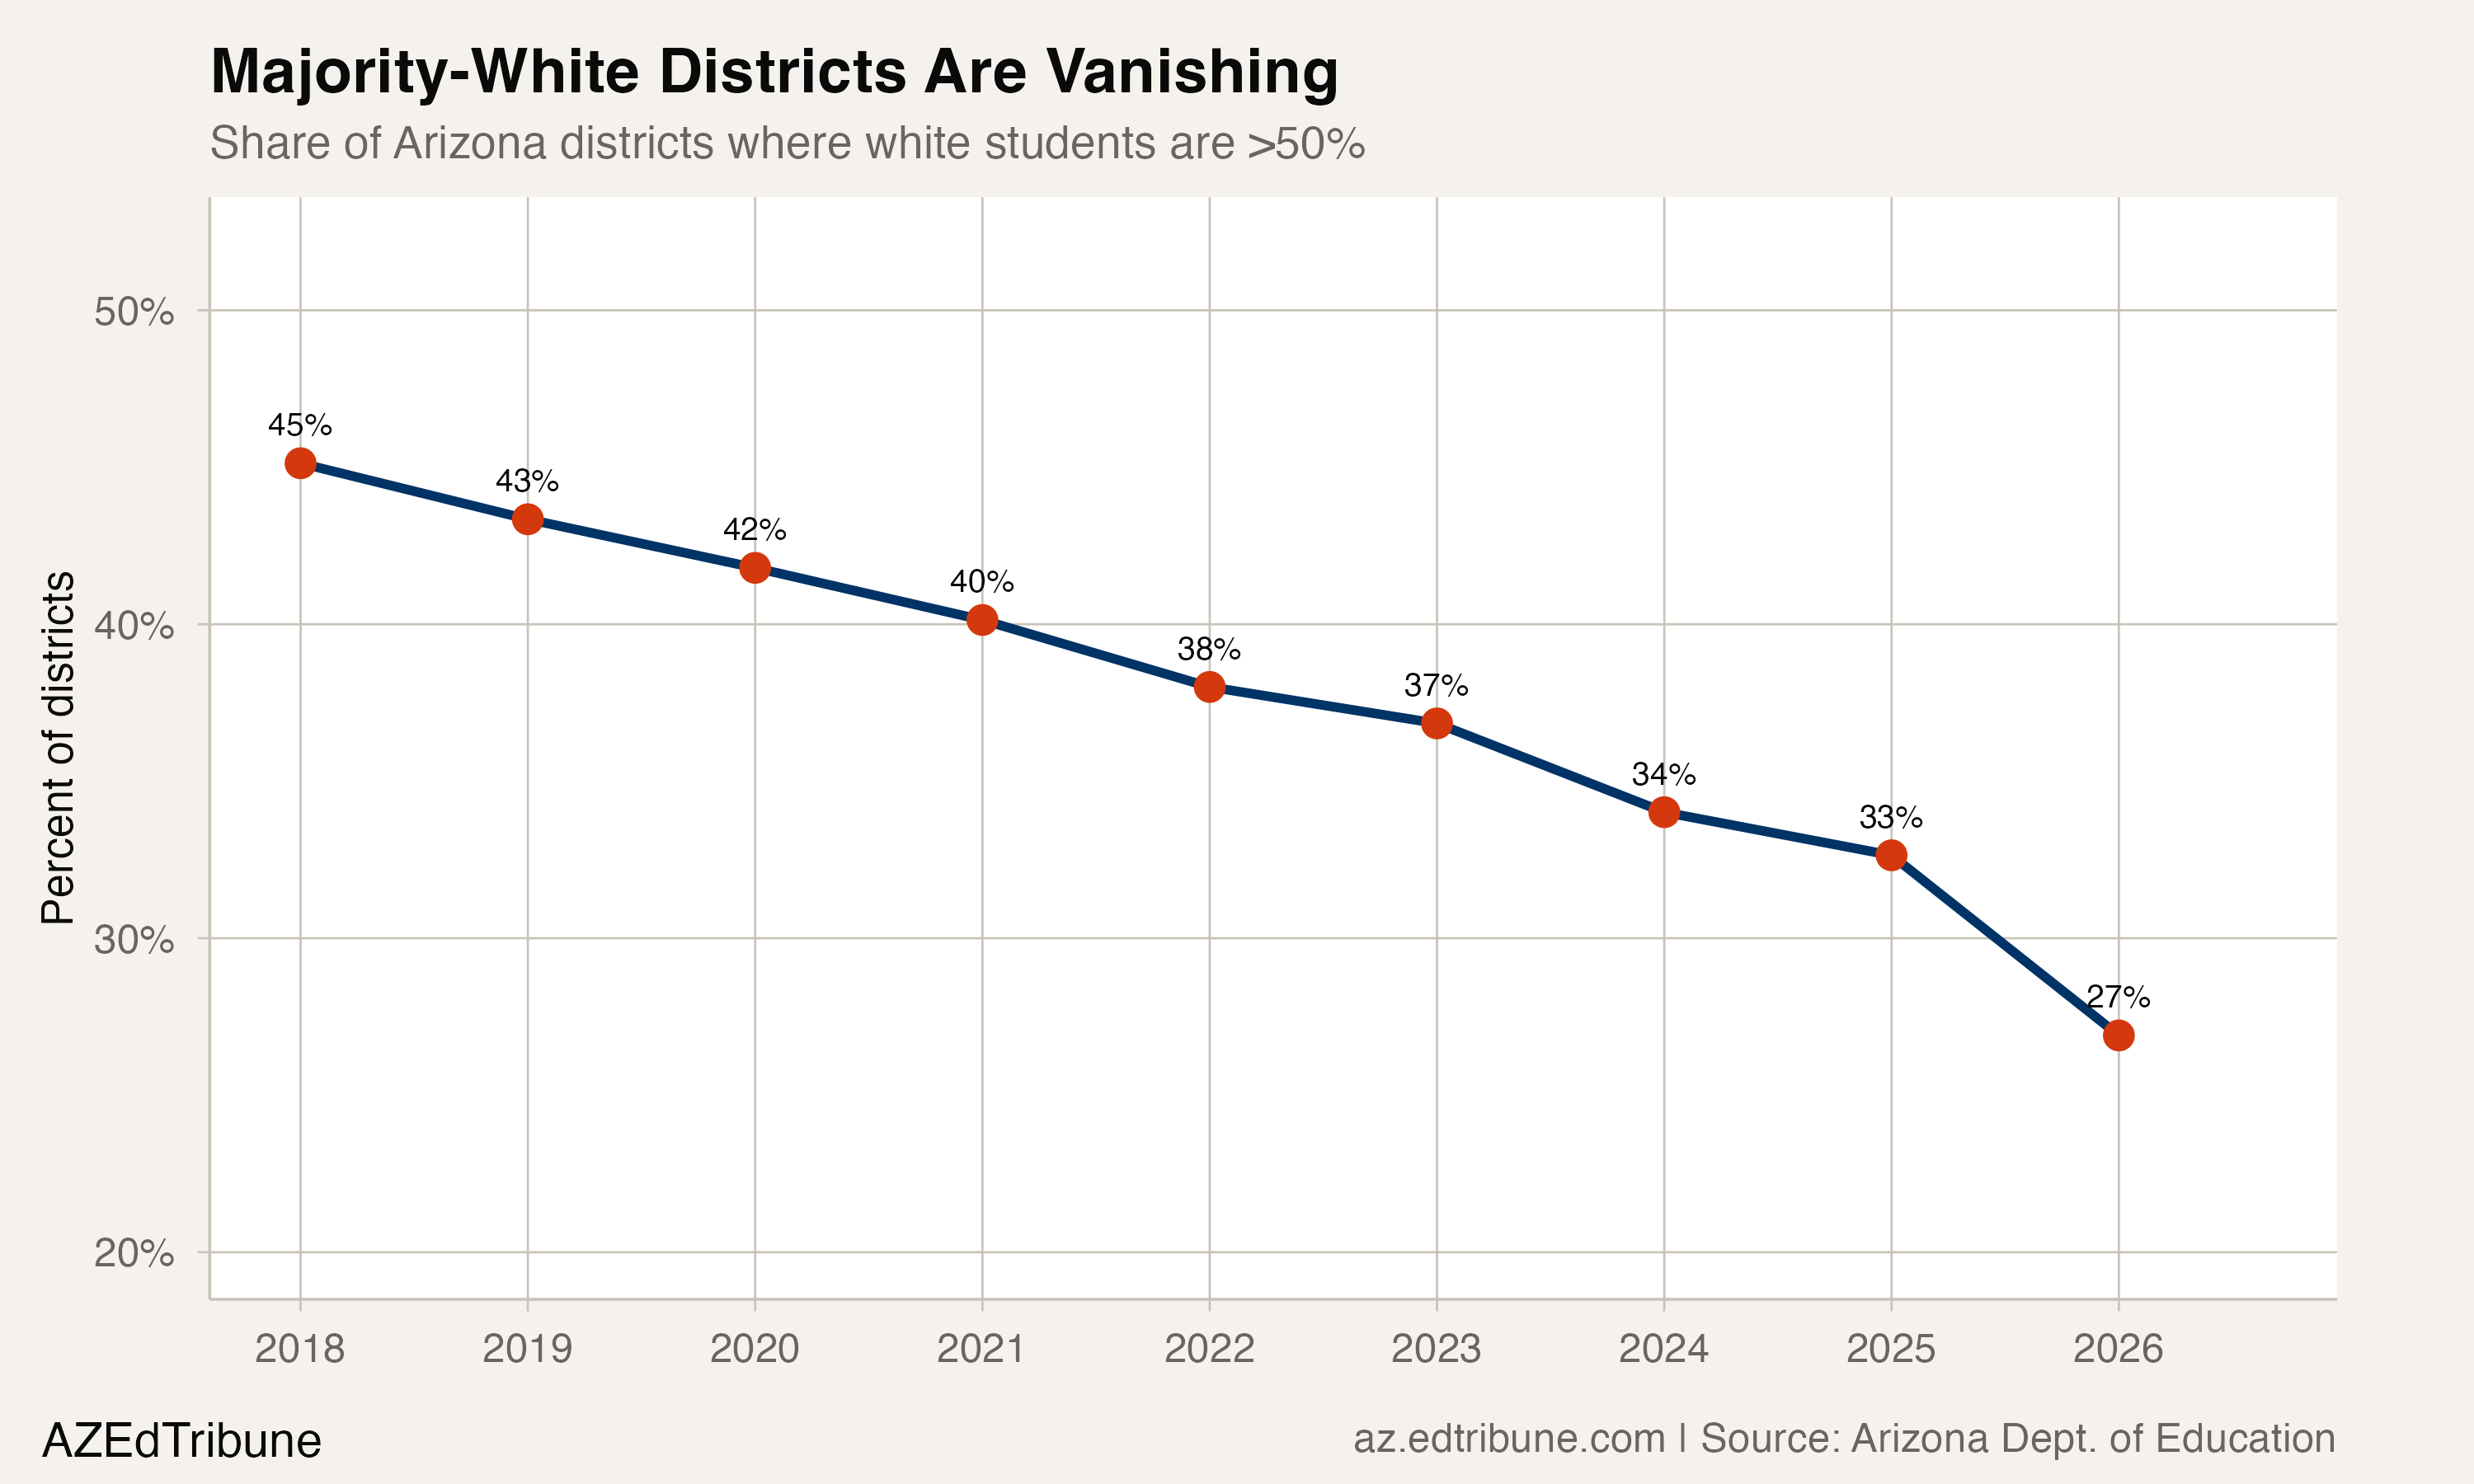
The flips span every type of community. Some are suburban districts where Hispanic and multiracial growth overtook a shrinking white base. Others are small rural districts where a handful of departures shifted the balance. The speed of the transition, 18 percentage points in eight years, means many districts are now operating in a demographic environment that bears little resemblance to the one that shaped their current staffing, curriculum, and community relationships.
What the data does not show
Until Arizona publishes ESA participation data by race, the relative weight of school choice versus demographic change will remain an open question. At the current trajectory of roughly 15,000 white students lost per year, white enrollment would fall below 300,000 by 2030.
Detailed code that reproduces the analysis and figures in this article is available exclusively to EdTribune subscribers.
Discussion
Sign in to join the discussion.
Loading comments...