Part of the Arizona Enrollment SeriesET. Updated weekly.
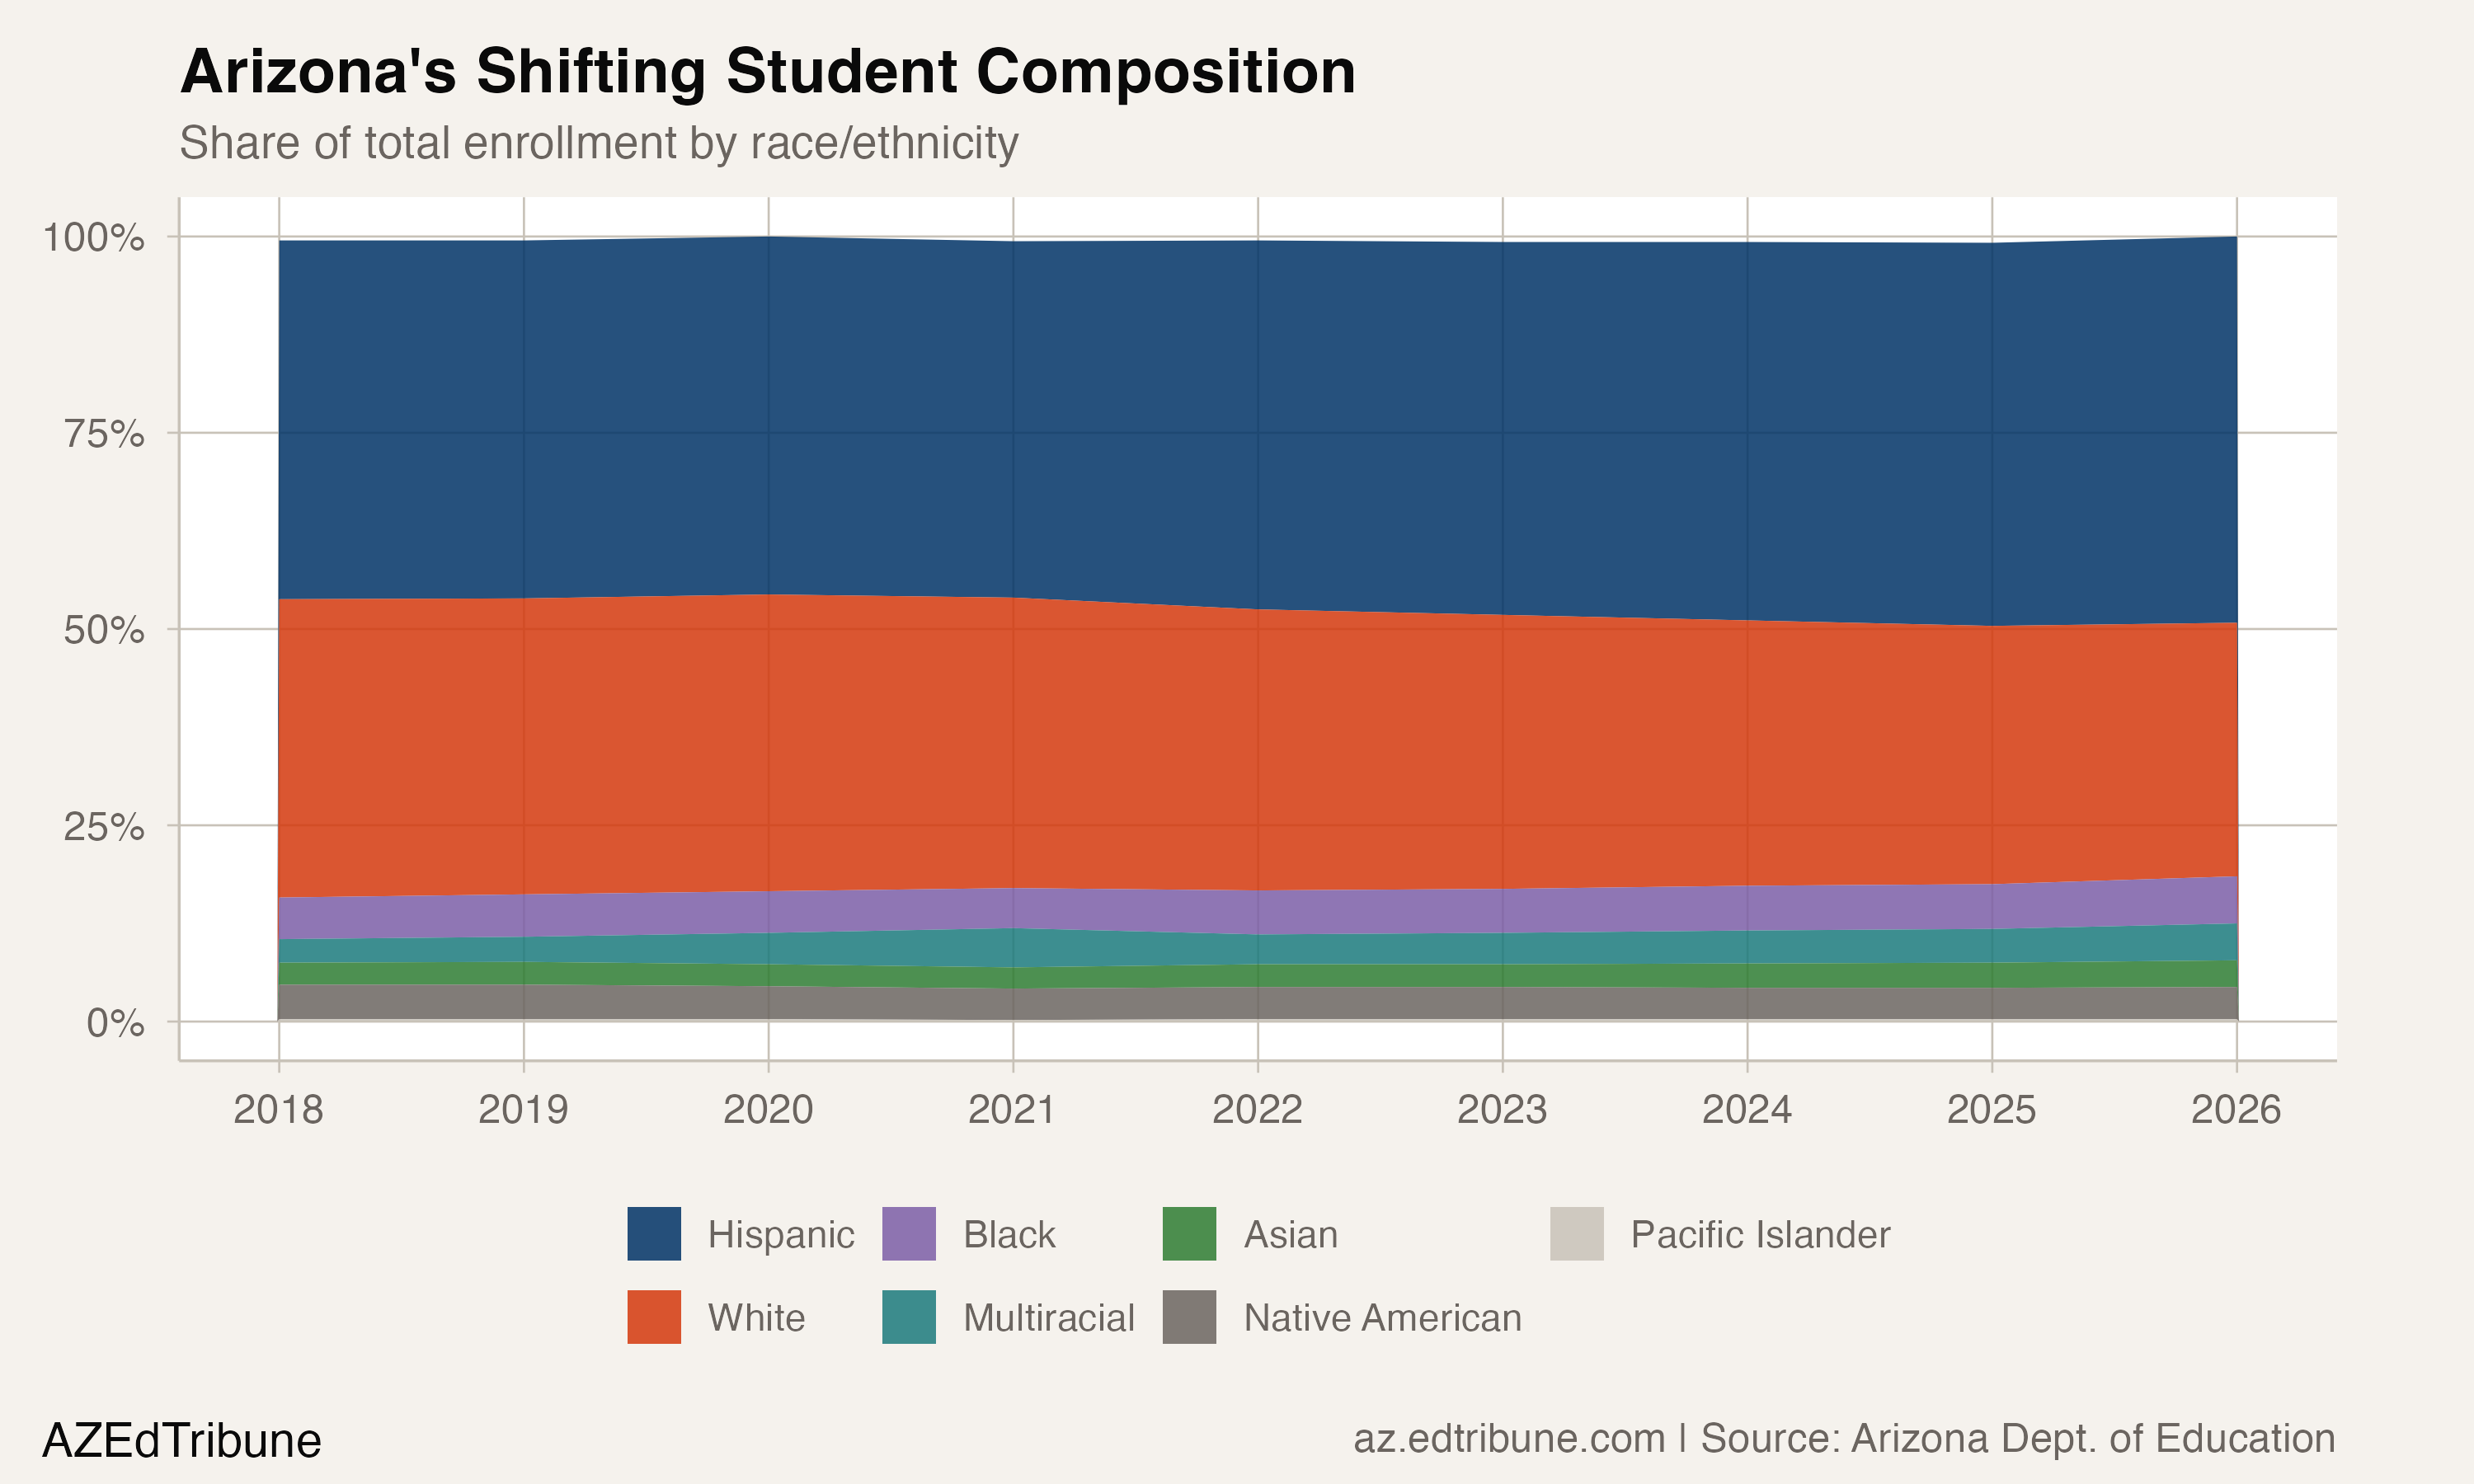
In 2025-26, Hispanic students account for 49.2% of all public school enrollment in Arizona. White students account for 32.3%. The gap between the two groups, 7.7 percentage points eight years ago, is now 16.9 points and widening every year.
At the current rate of change, roughly half a percentage point per year, Hispanic students will cross the 50% threshold as early as the 2027-28 school year. Arizona would join New Mexico, California, and Texas among states where Hispanic students are the outright majority in public schools. The shift is not being driven by a Hispanic enrollment boom. It is being driven by a white enrollment collapse.
Two groups, two directions
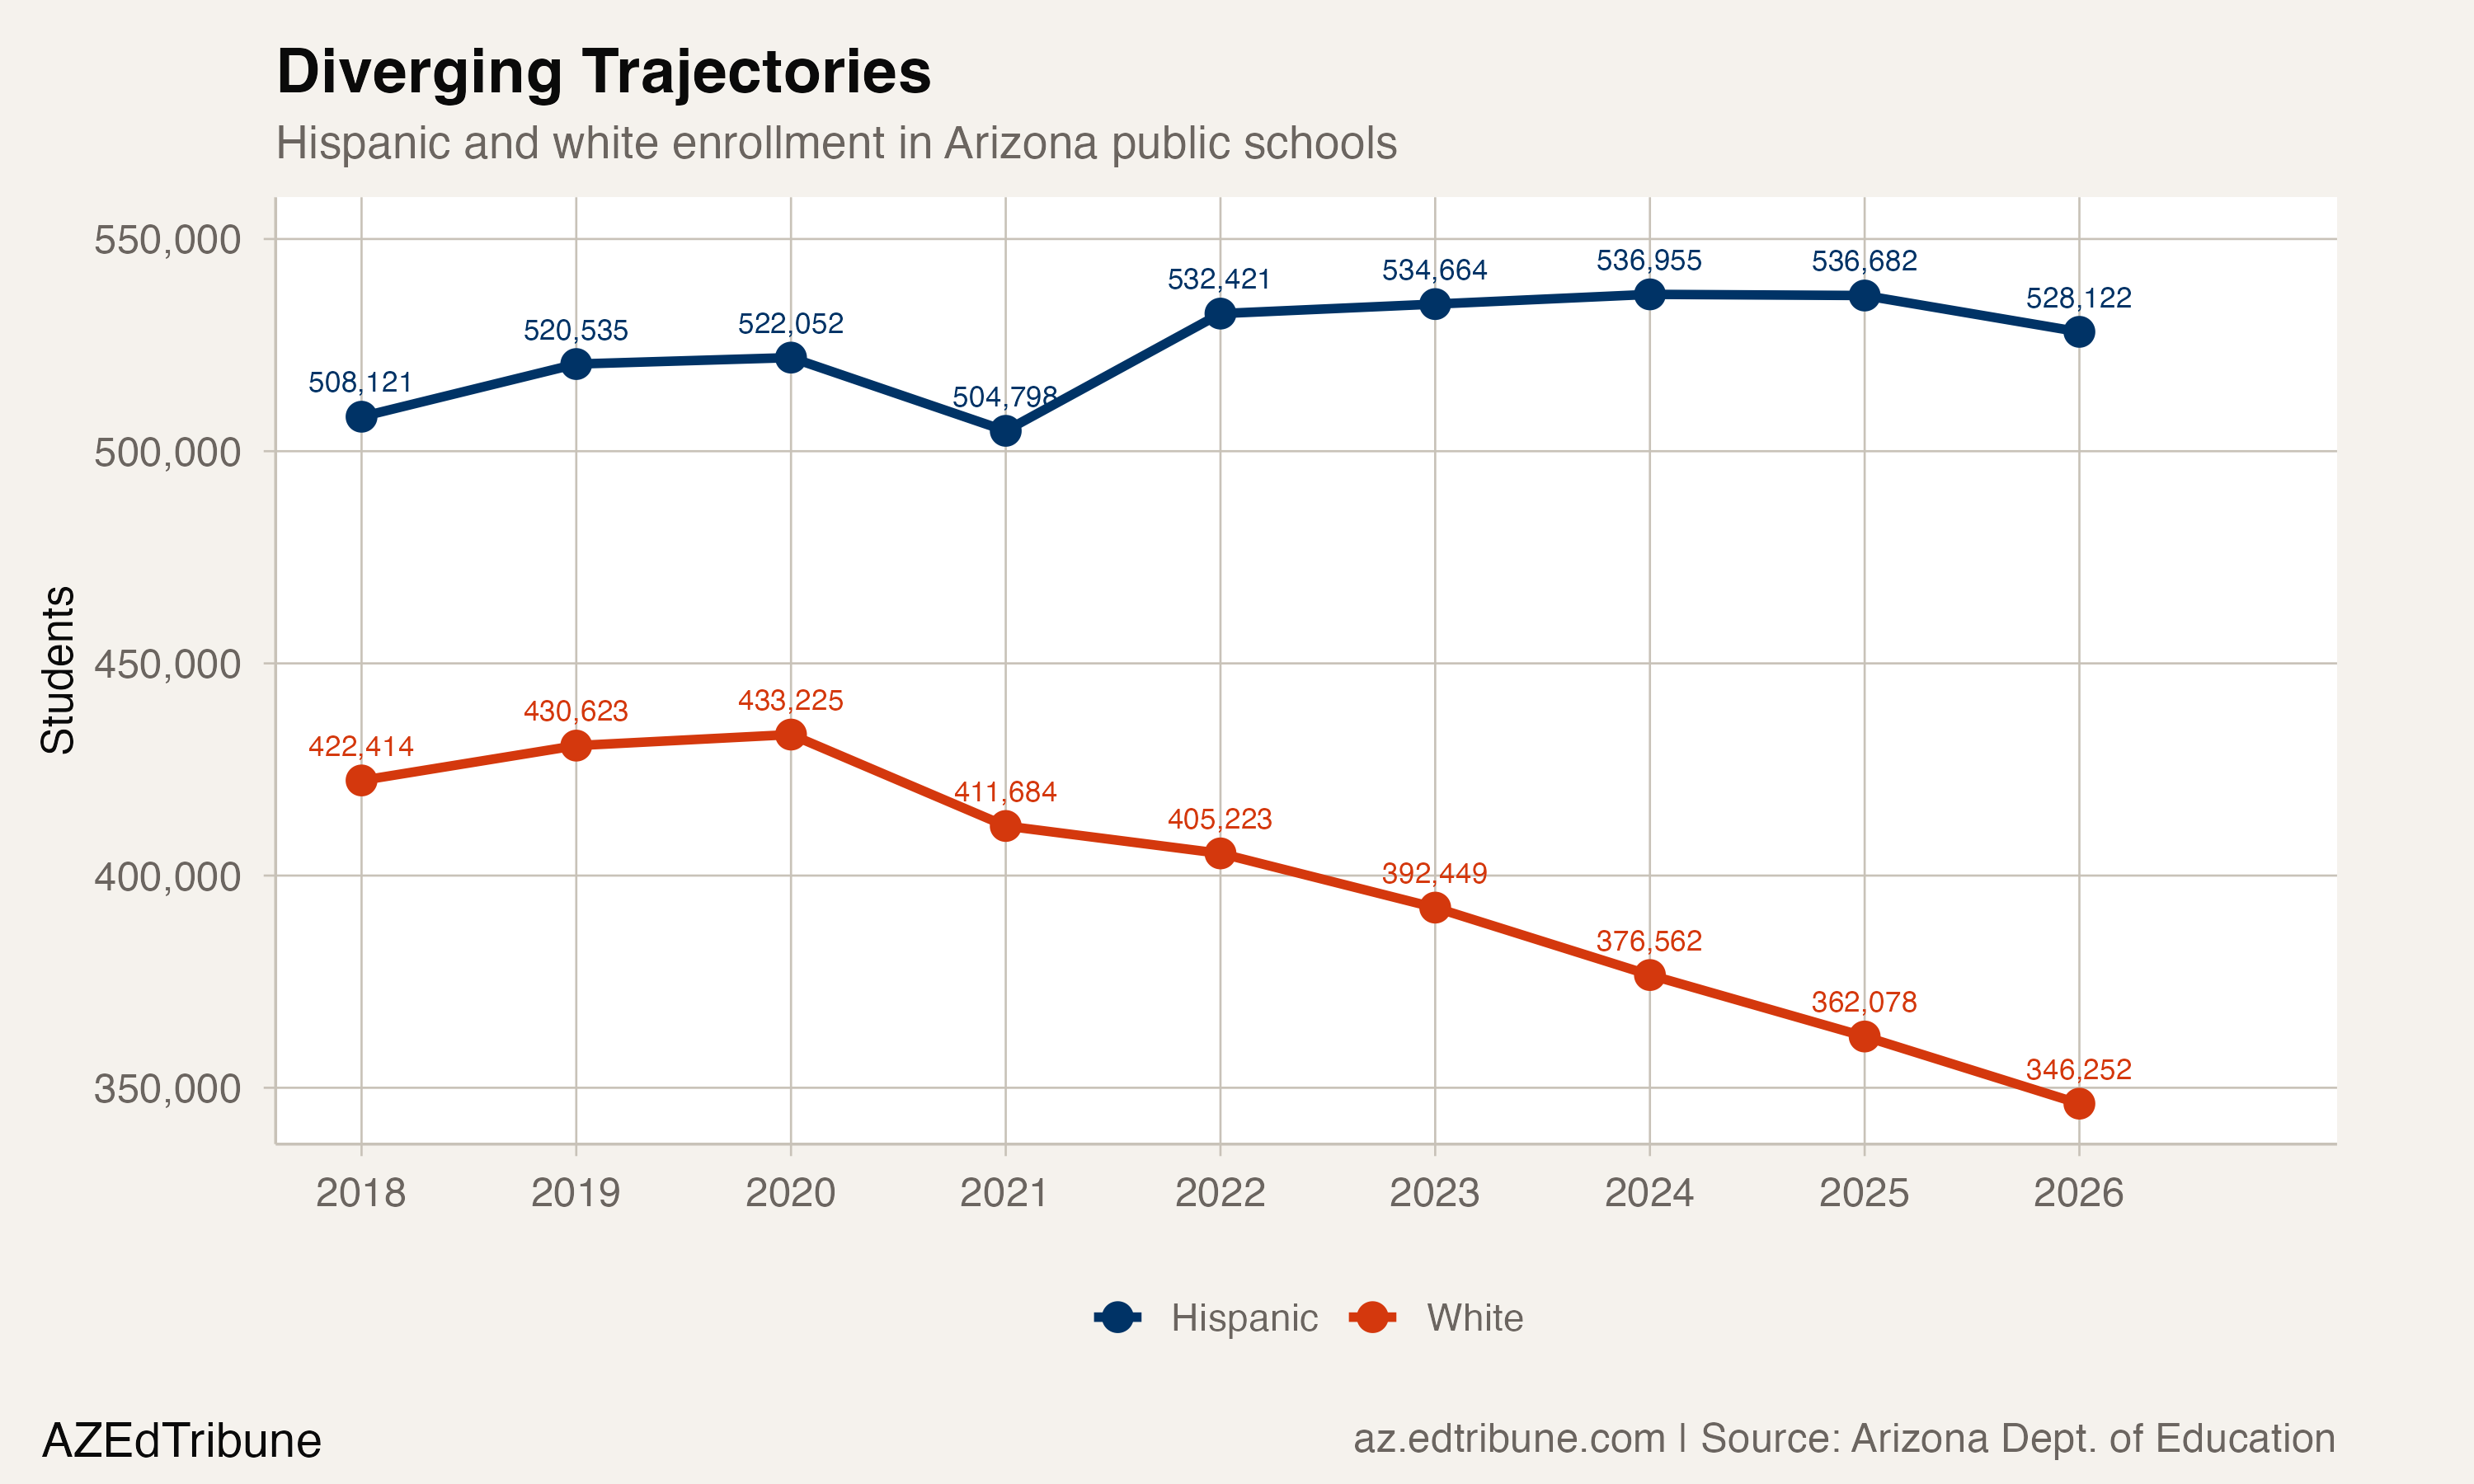
Between 2017-18 and 2025-26, Hispanic enrollment in Arizona grew by 20,001 students, a 3.9% increase. White enrollment fell by 76,162 students, an 18.0% decline. The total student population dropped by 39,151 over the same period, from 1,112,682 to 1,073,531. White students accounted for virtually all of that decline and then some: the 76,162 lost white students exceeded the total enrollment drop because gains among Hispanic, Black, Asian, and multiracial students partially offset it.
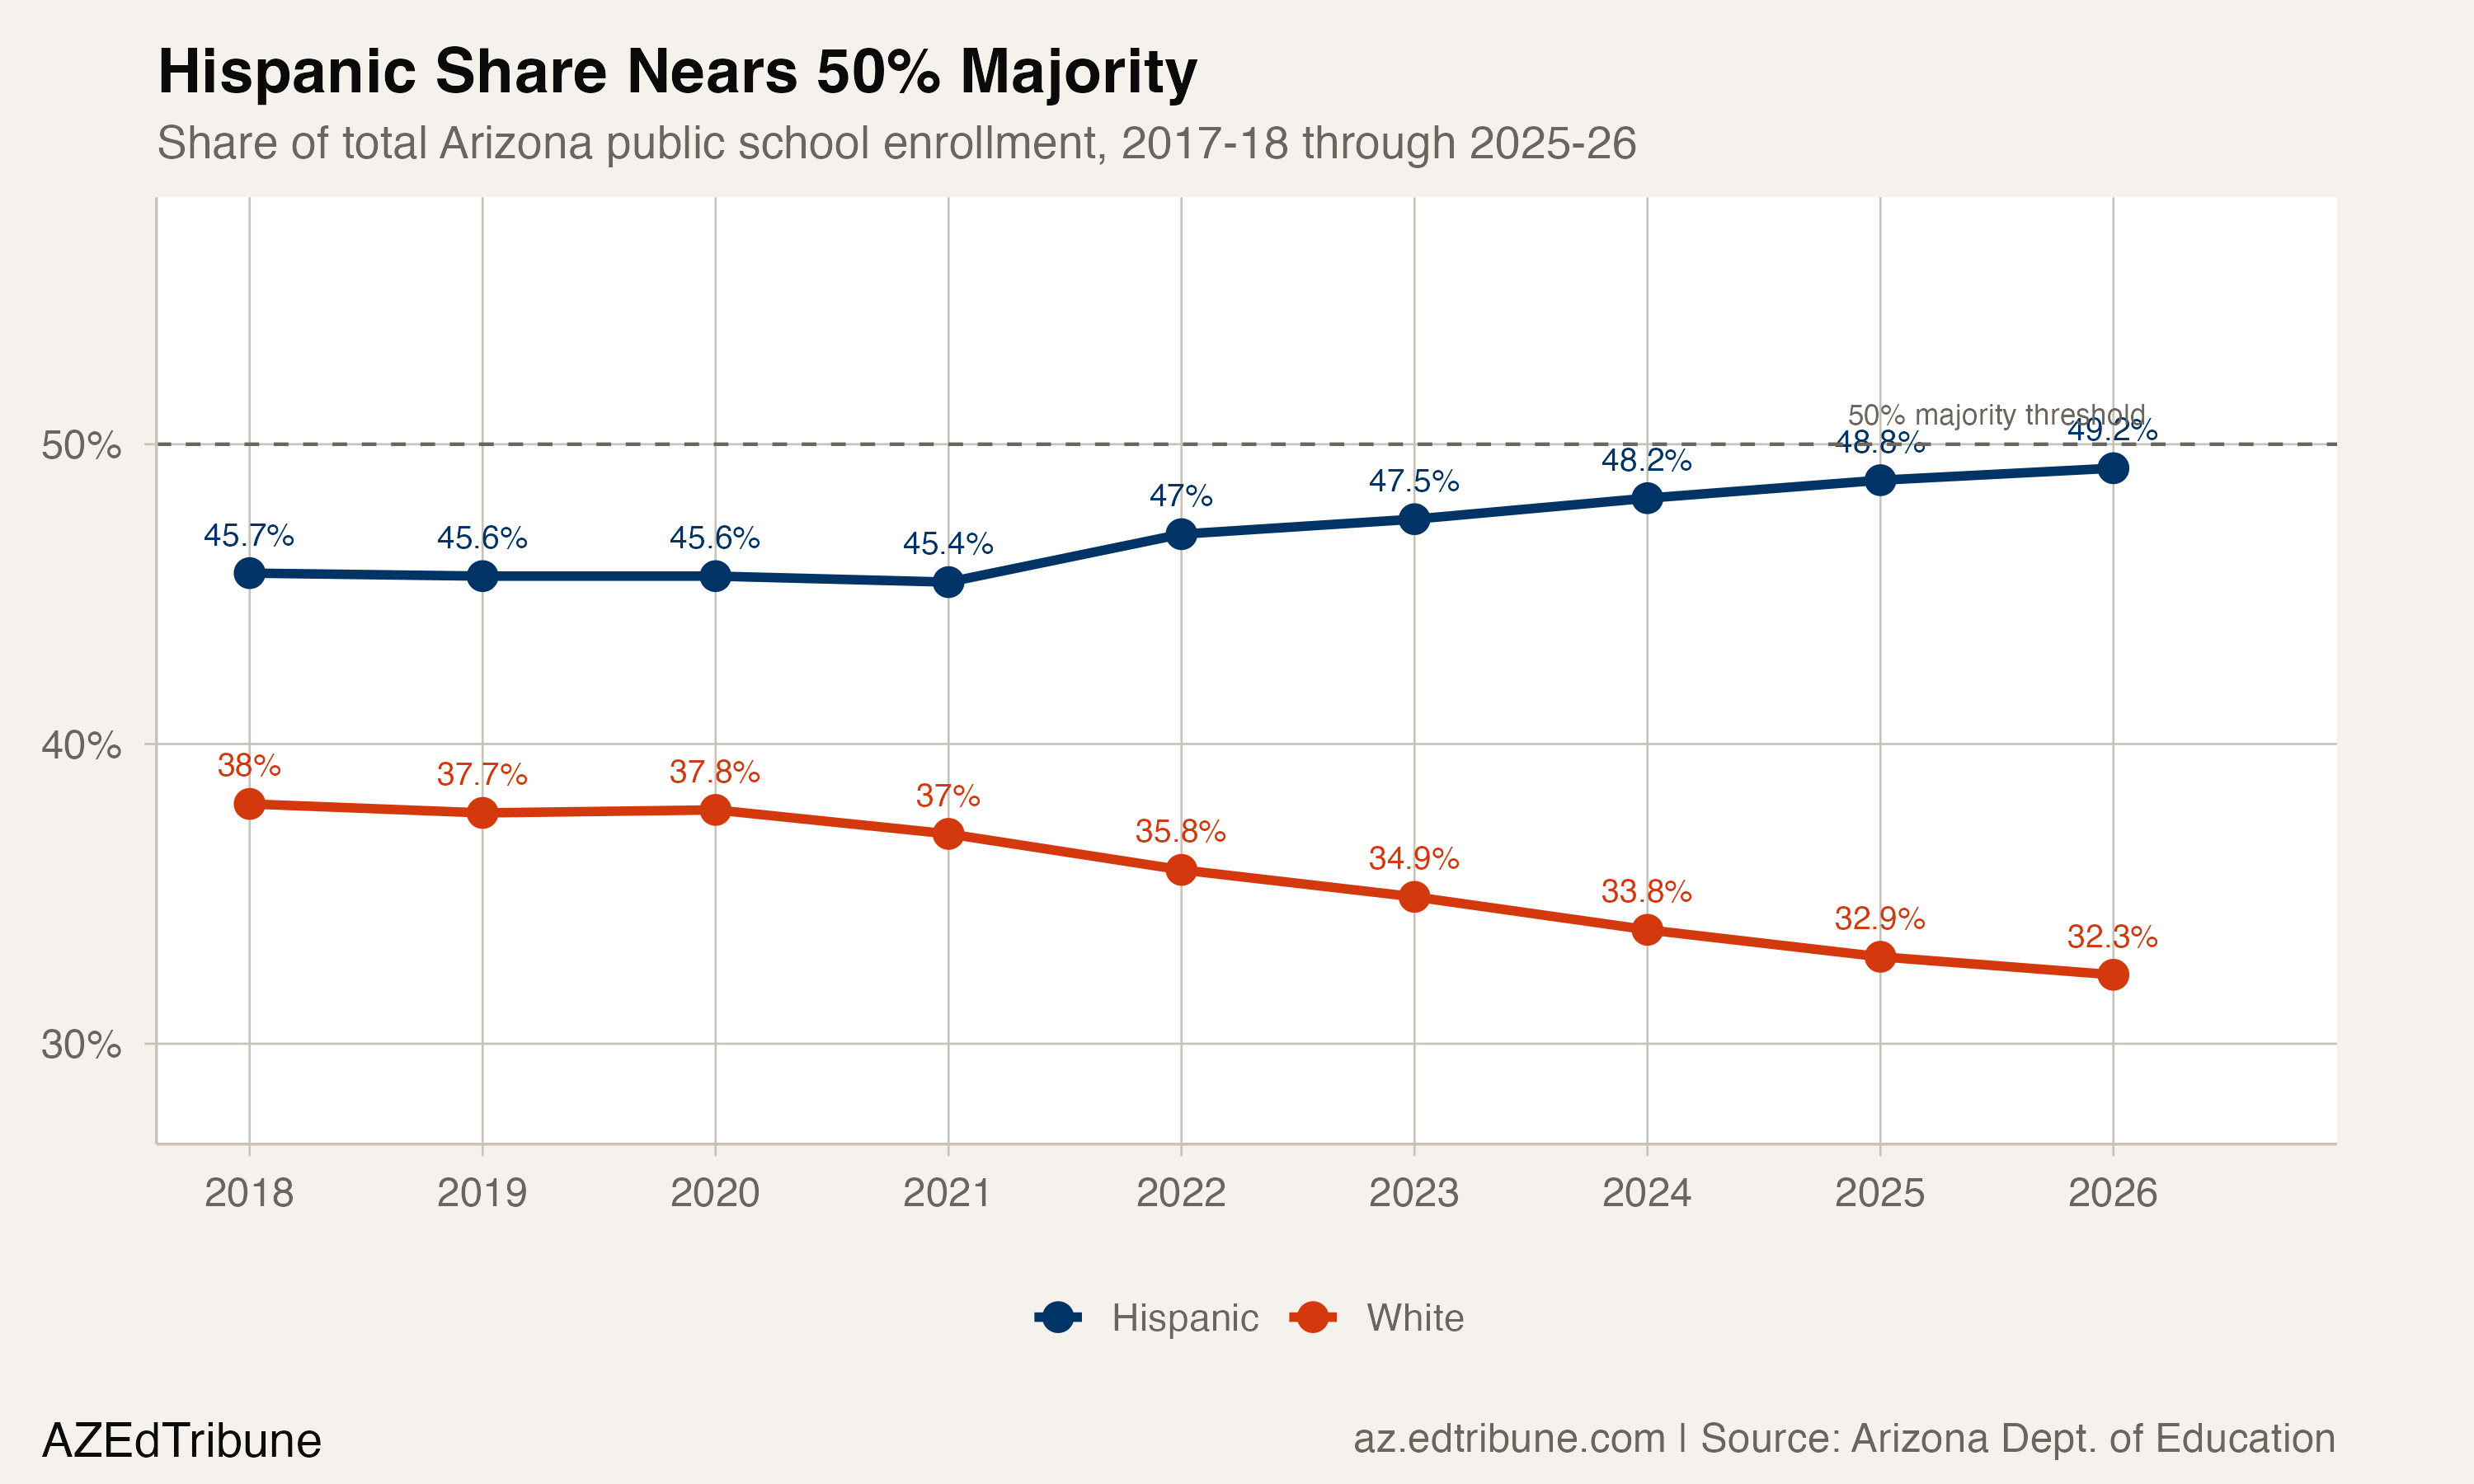
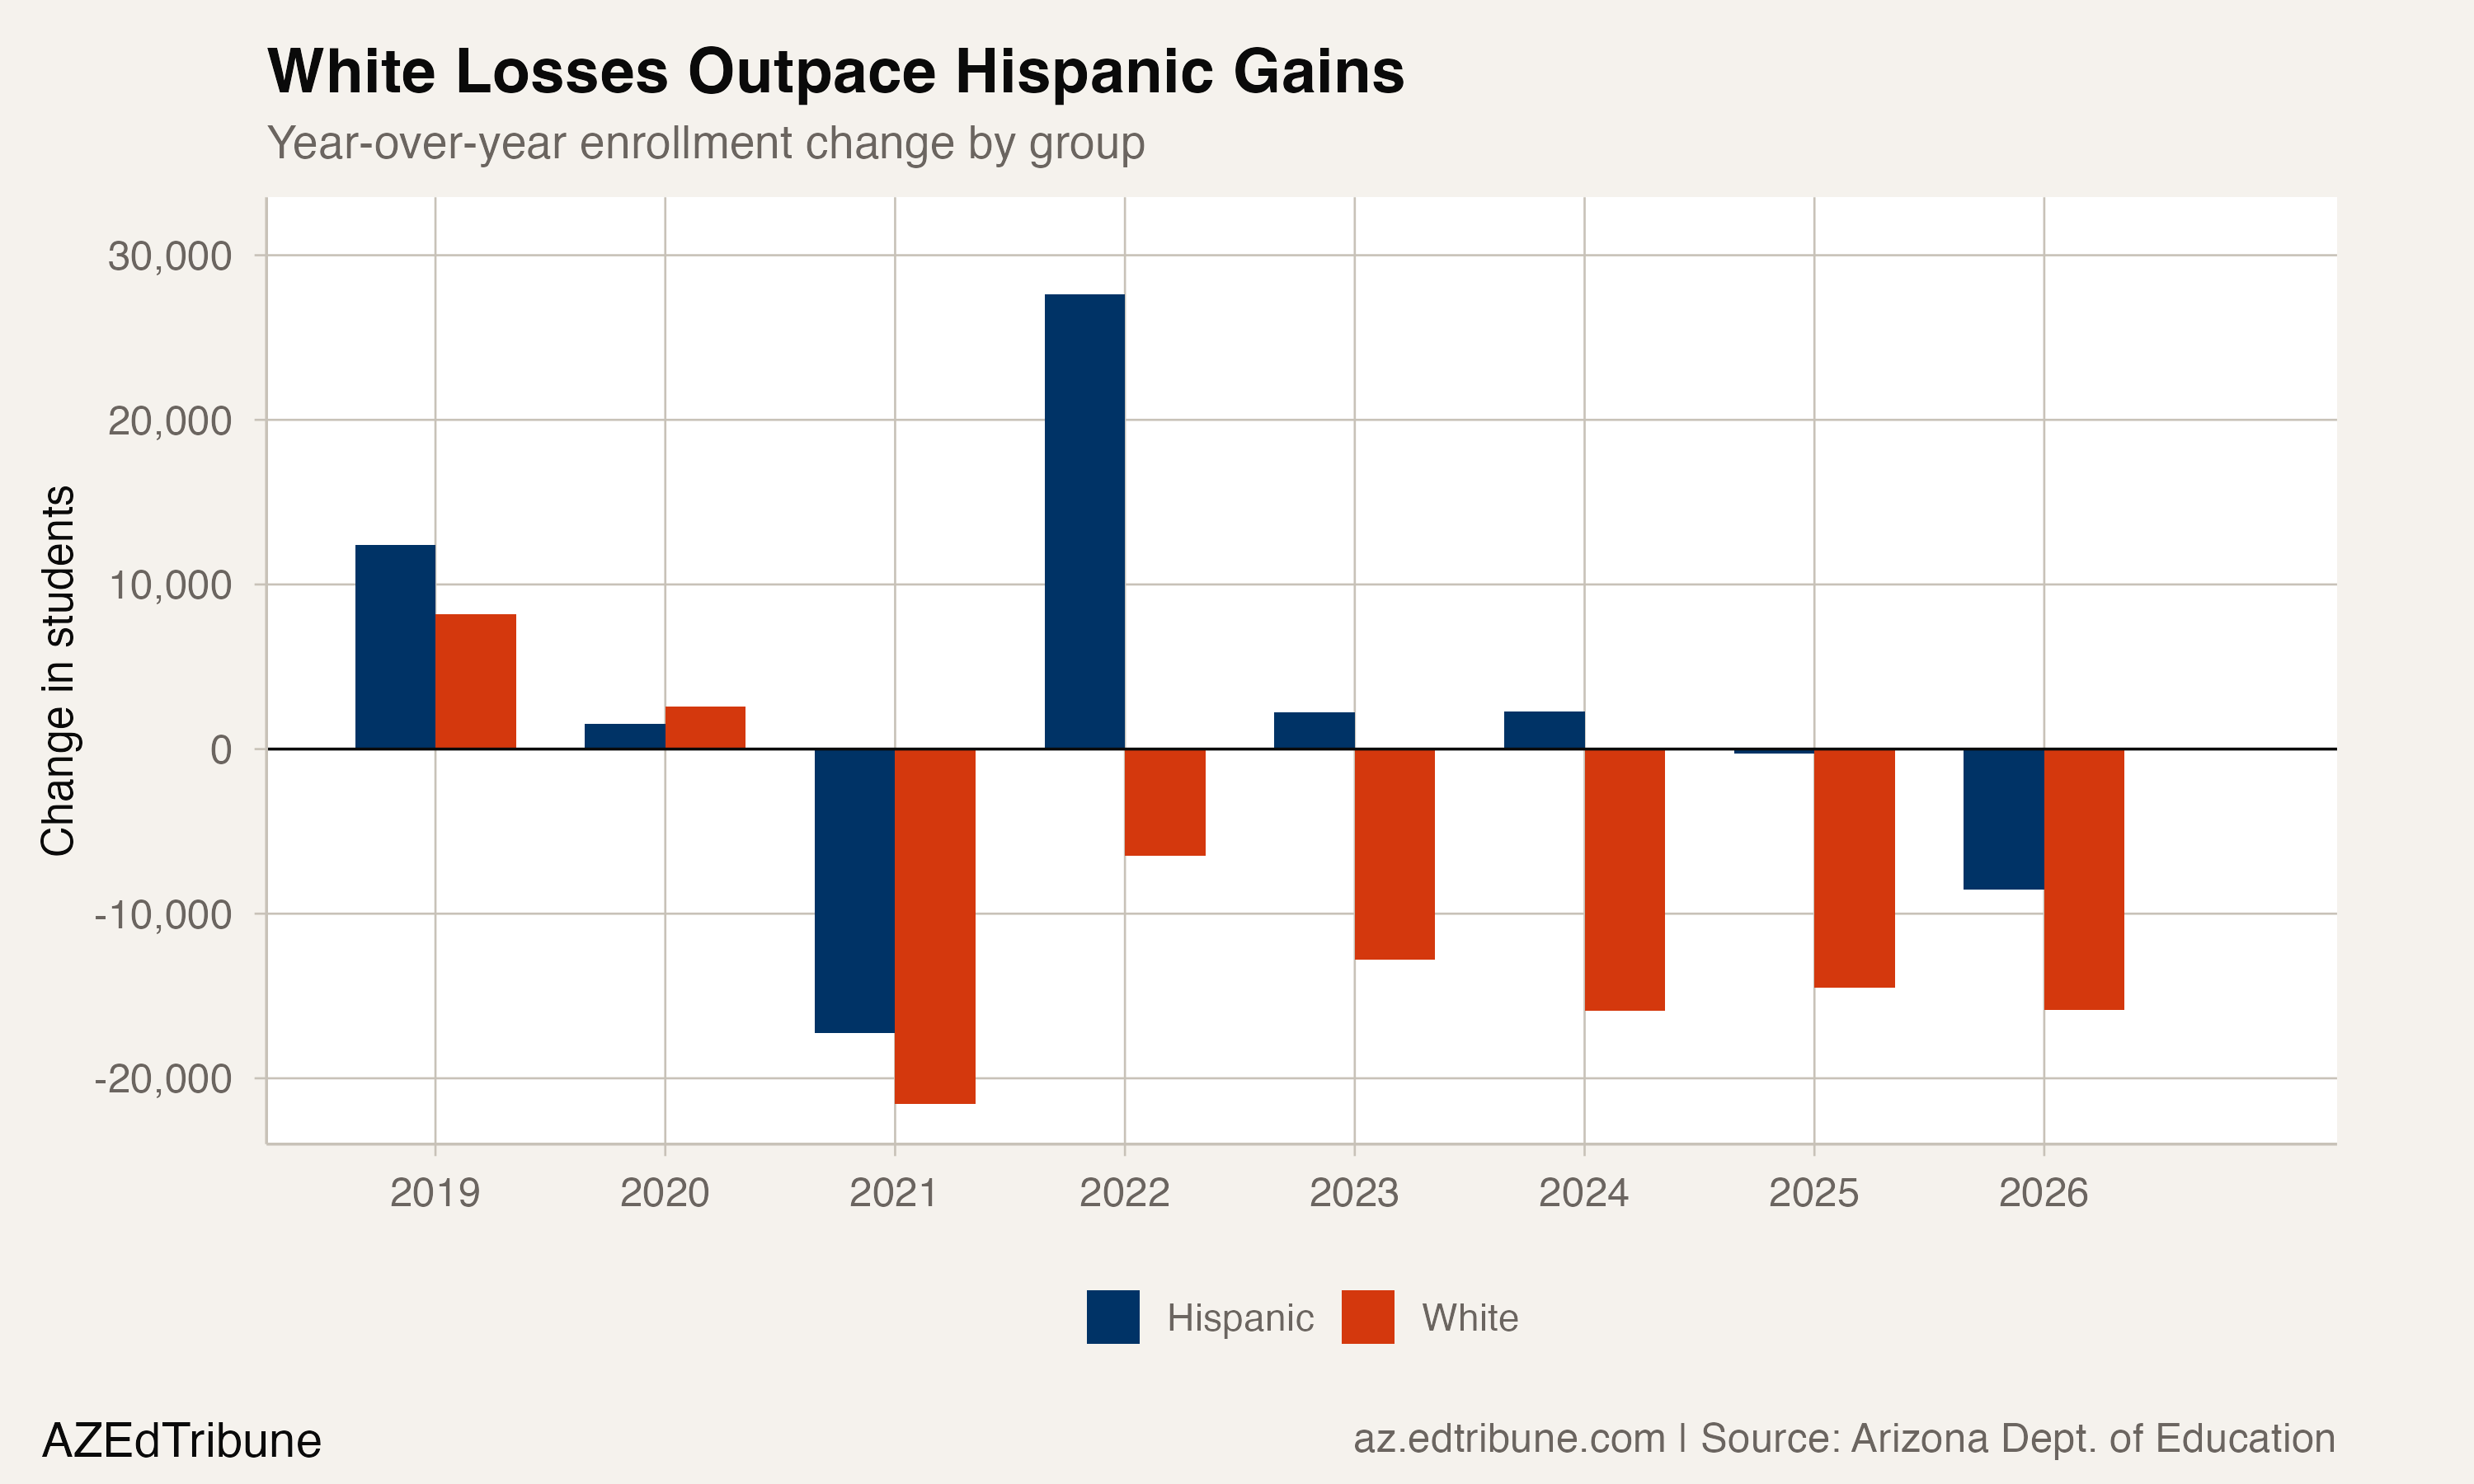
The two lines on the share chart tell different stories. The Hispanic line is nearly flat in absolute terms, hovering between 504,000 and 537,000 throughout the period. Its share rose because the denominator shrank. The white line, by contrast, has fallen in every year since 2020, losing between 6,461 and 21,541 students annually.
Put differently: Arizona is approaching a Hispanic majority not because Hispanic families are flooding into the system, but because white families are leaving it.
Where the white students went
White enrollment peaked at 433,225 in 2019-20 and has declined every year since, losing 86,973 students in six years. That is a 20.1% drop from peak. Several forces are working in the same direction.
The most direct factor is demographics. A Population Reference Bureau analysis documented a stark age divide in Arizona: as of 2008, the median age of the white population was 43, compared to 26 for Latinos. The birth-to-death ratio was 1.2 for whites and 8.9 for Latinos. That generational gap has only widened in the years since. Arizona's white population is aging out of its child-bearing years; the school-age cohort reflects that reality with a lag.
Arizona's universal Empowerment Scholarship Account program, which expanded in 2022, is a plausible accelerant. AZPM reported in February 2026 that the program now administers over 100,000 vouchers, up from 11,000 three years earlier, at an annual cost of roughly $1 billion from the General Fund. While the program is open to all families, a Cronkite News analysis found that 78% of ESA recipients were already enrolled in private school or homeschooled, suggesting the program largely subsidized existing private education choices rather than triggering new exits from public schools.
The timing of ESA expansion and white enrollment decline overlap, but the annual rate of white loss has been roughly consistent: about 14,000 per year from the 2020 peak through 2022, and about 14,700 per year from 2022 through 2026. The white decline predates the ESA expansion and has continued at a similar pace since. Whether ESA accounts are accelerating a pre-existing demographic trend, or simply coinciding with it, cannot be determined from enrollment data alone.
A generational pipeline
The composition shift visible in aggregate data is more advanced among younger cohorts. Arizona's race/ethnicity data is not broken down by grade level, but the broader population data tells the story: Census estimates show Arizona's Hispanic population grew 1.9% between 2022 and 2023 alone, outpacing the 0.4% growth among non-Hispanic residents.
Because Hispanic families skew younger, each entering kindergarten class is more Hispanic than the graduating senior class it replaces. This pipeline effect means the 50% crossing is a lagging indicator of a shift that has already occurred in the youngest grades.
Already the majority in 232 districts
At the district level, the Hispanic majority is not approaching. It has already arrived. Of the 520 Arizona districts and charter entities with at least 100 students, 232, or 44.6%, have a Hispanic enrollment share above 50% in 2025-26.
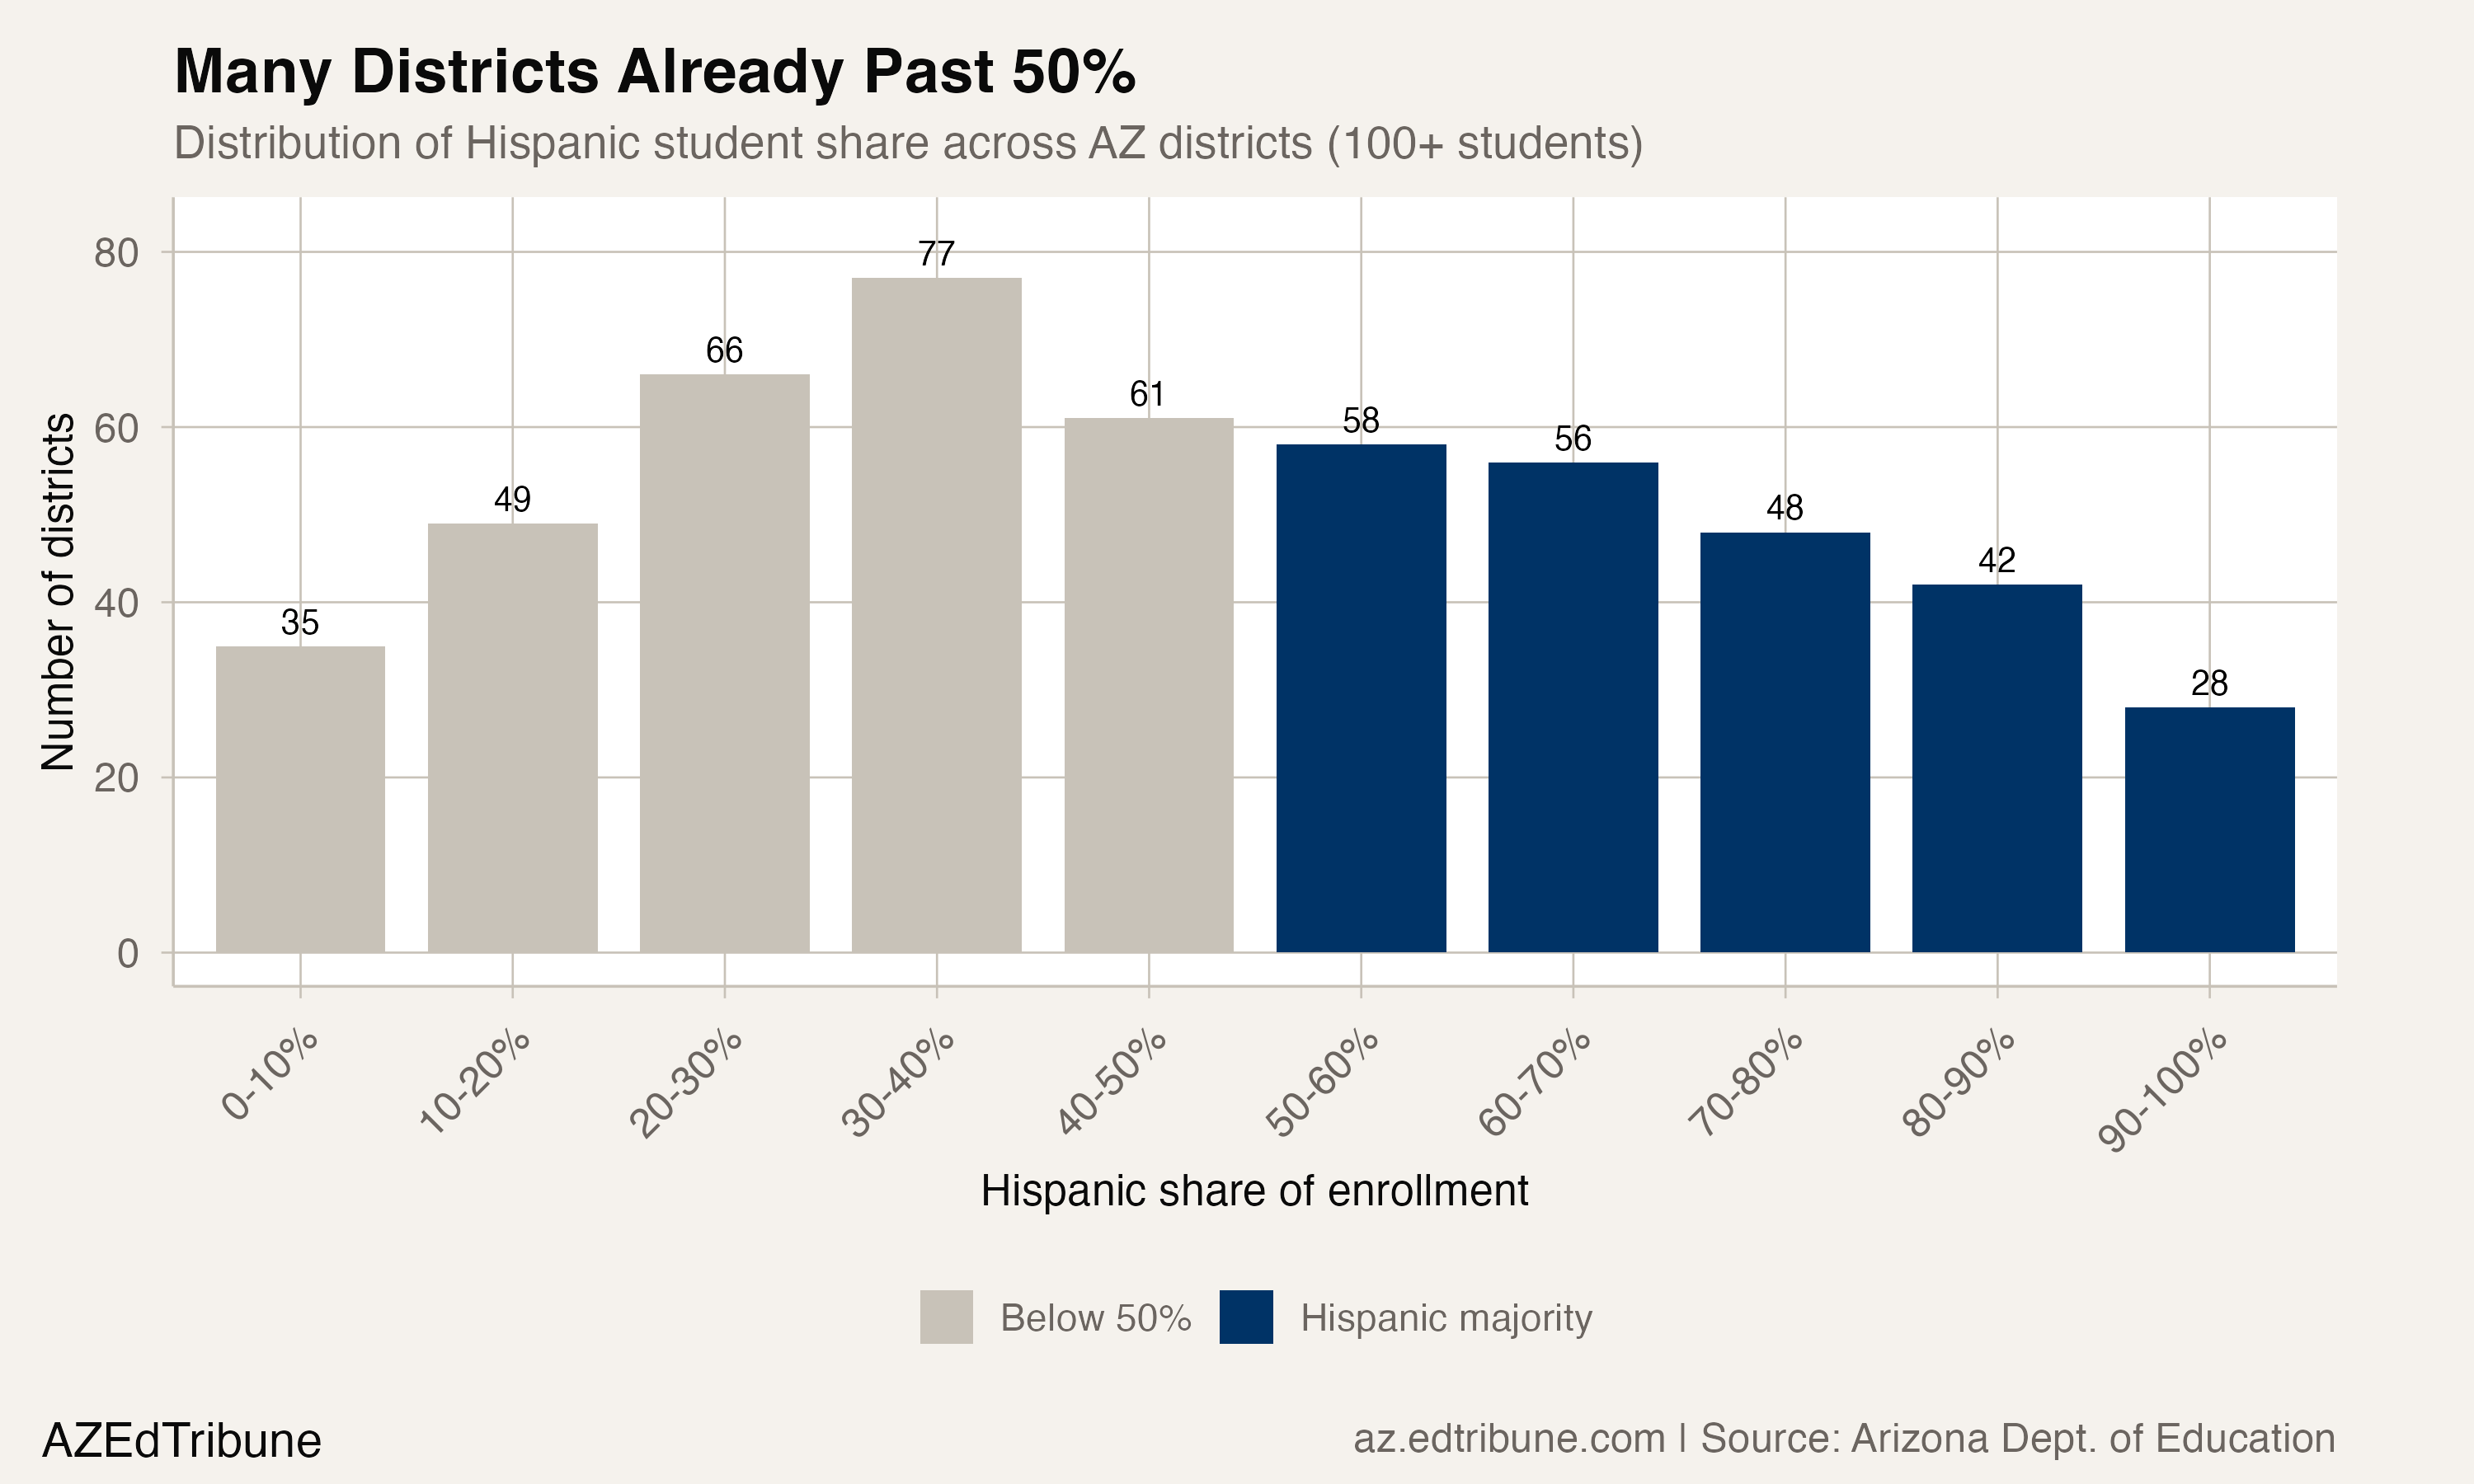
The crossover is not limited to border communities or historically Hispanic areas. Agua Fria Union High School District, a 10,240-student district in the western Phoenix suburbs, went from 46.9% Hispanic in 2017-18 to 55.3% in 2025-26. Saddle Mountain Unified, between Phoenix and Gila Bend, jumped from 43.4% to 68.2%. Bullhead City, on the Nevada border, crossed 50% for the first time, reaching 54.3%.
The representation gap in the classroom
A student body that is 49.2% Hispanic is taught by a workforce that is 16% Hispanic. Cronkite News reported that only 16% of Arizona's 58,000 teachers identify as Latino, a gap of more than 33 percentage points.
"When students have a teacher who looks like them, they perform better on tests, they attend school at higher rates, so the absenteeism rates go down." — Stephanie Parra, ALL In Education, via Cronkite News (April 2022)
That gap is structural. Only 71% of Latino students in Arizona graduate high school in four years, and only 22% of those graduates enter four-year colleges. The teacher pipeline, in other words, draws from a pool that the education system itself has not fully served.
Not just a two-group story
The Hispanic-white share shift dominates the composition chart, but other groups are moving. Multiracial enrollment grew 51.3% over eight years, from 33,218 to 50,252, now comprising 4.7% of total enrollment. Asian enrollment rose 17.7%. Black enrollment grew 9.3%. Native American enrollment fell 9.4%, from 48,579 to 43,989, a decline of 4,590 students that receives far less attention than the white decline but represents a proportionally comparable loss within its group.
The 2025-26 composition: Hispanic 49.2%, white 32.3%, Black 6.0%, multiracial 4.7%, Native American 4.1%, Asian 3.4%, Pacific Islander 0.3%.
What the 50% line means, and what it does not
A statistical majority does not confer political power, institutional representation, or resource equity. Arizona's Hispanic students will cross 50% in a system where the teaching workforce is 16% Hispanic, the ESA voucher program disproportionately serves families already outside the public system, and per-pupil funding in public schools trails voucher amounts by $700 to $900 per student.
The 2026-27 enrollment count is expected in fall 2026. If Hispanic enrollment holds near 528,000 while the white decline continues at roughly 15,000 per year, the crossing is arithmetic. What follows is less certain. A statistical majority does not automatically reshape the institutions that serve it.
Detailed code that reproduces the analysis and figures in this article is available exclusively to EdTribune subscribers.
Discussion
Sign in to join the discussion.
Loading comments...