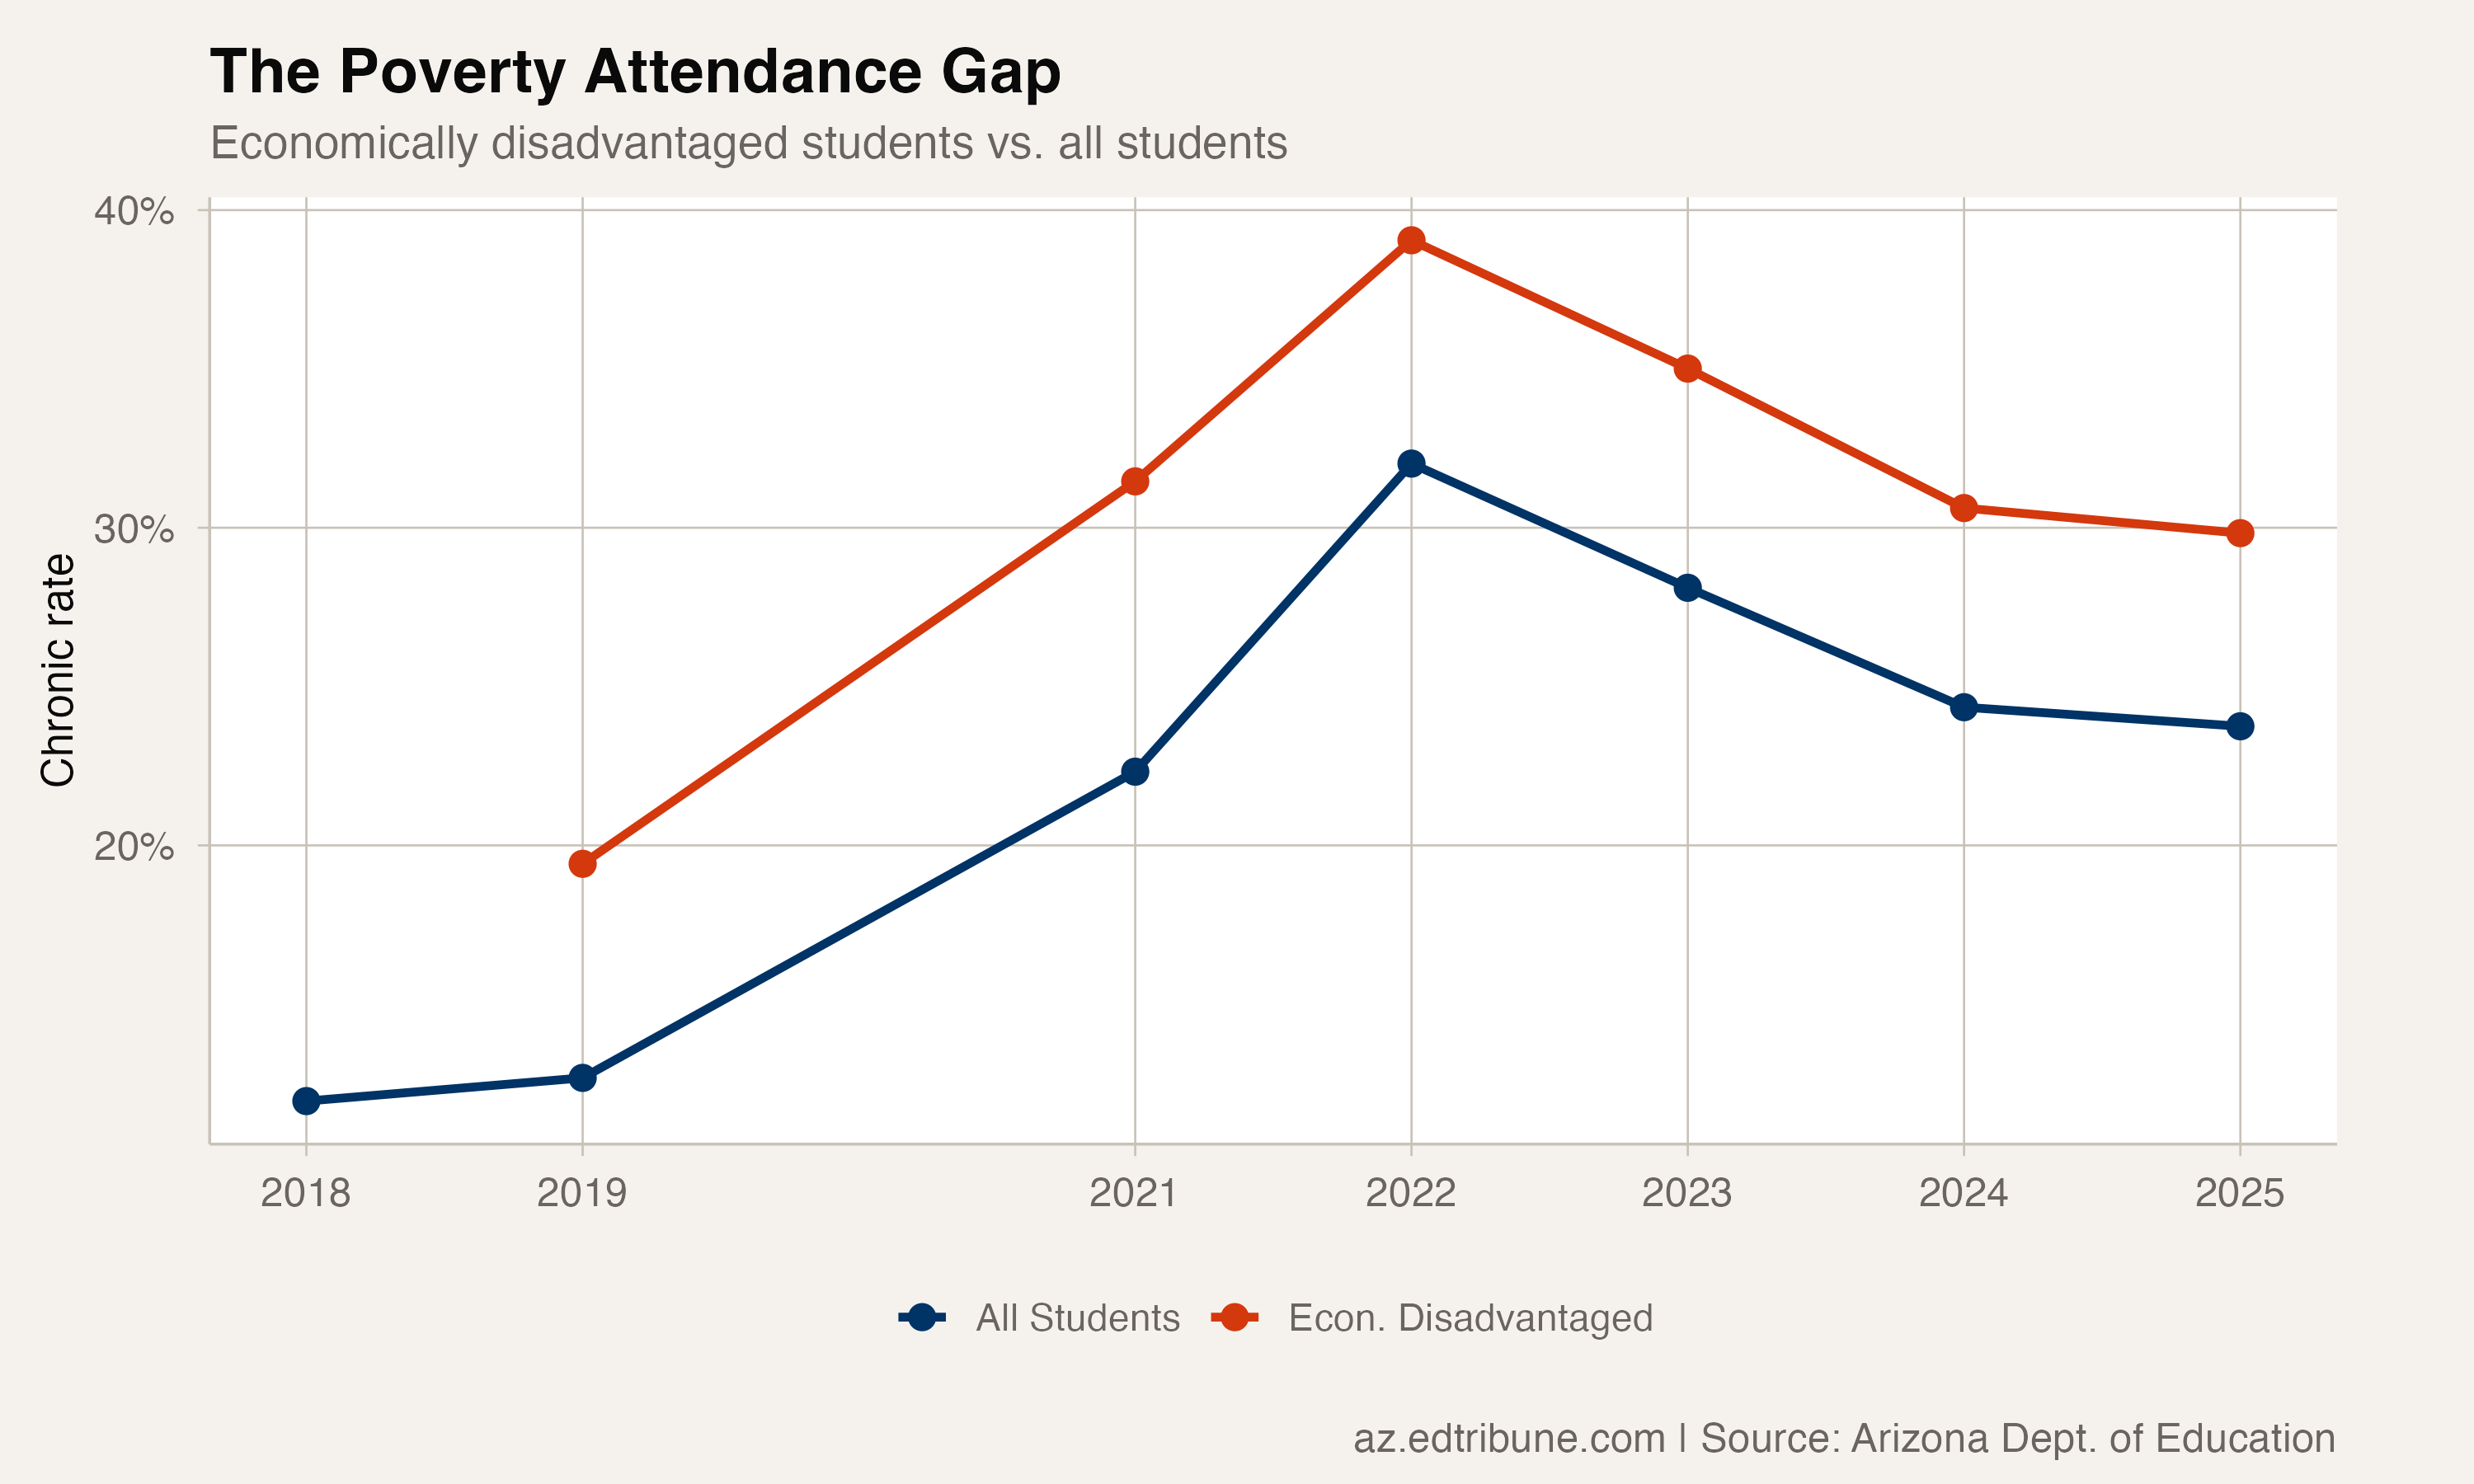
Economically disadvantaged students in Arizona had a 29.8% chronic absenteeism rate in 2024-25, compared to 23.8% overall. The 6.1 percentage point gap means that nearly three in ten low-income students are missing at least 18 days of school per year.
Before COVID, the gap was slightly wider in absolute terms — 6.7 points in 2018-19 (19.4% vs. 12.7%). But both rates have shifted dramatically upward. The economically disadvantaged rate is now 10.4 points above its pre-COVID level. The overall rate is 11.1 points above.
The Gap Is Persistent, Not Growing
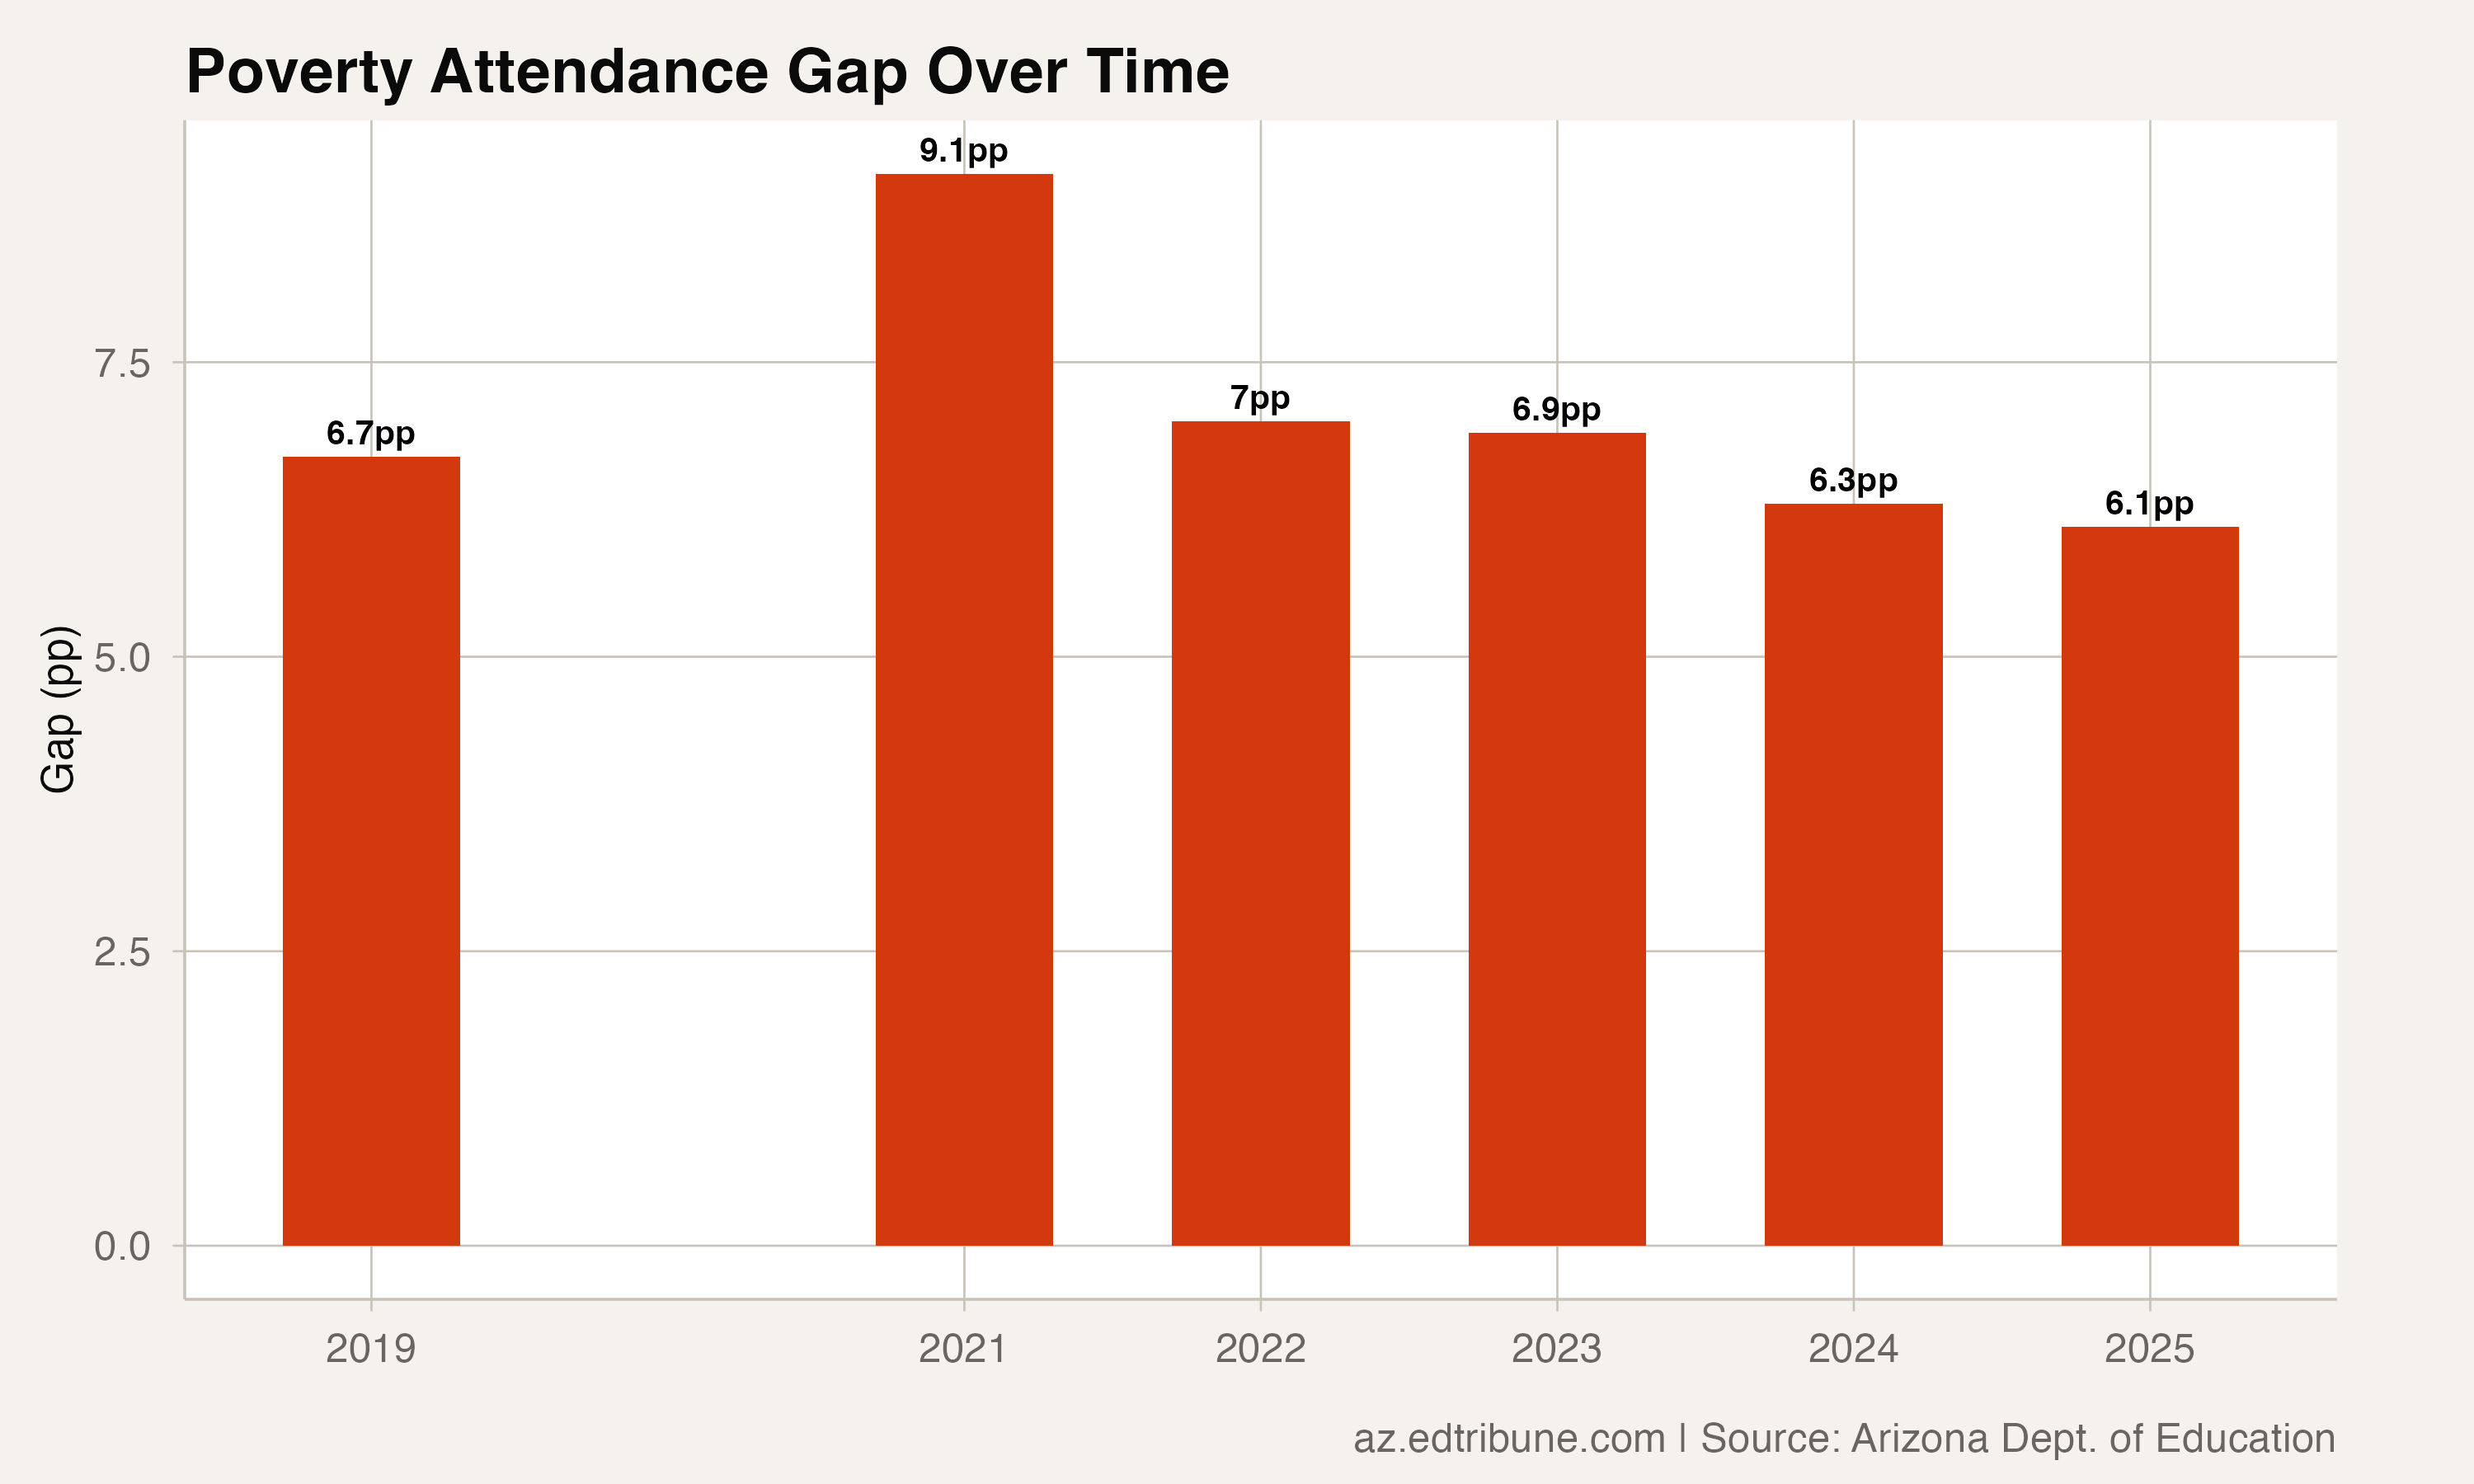
Unlike the racial gaps that widened after COVID, the poverty gap has remained relatively stable, fluctuating between 6 and 9 points since 2018. The pandemic temporarily pushed it to 9.1 points in 2020-21, and the 2021-22 peak compressed it to 7.0 points as overall rates surged. Since then, it has hovered around 6-7 points.
| Year | Econ. Disadv. | Overall | Gap |
|---|---|---|---|
| 2018-19 | 19.4% | 12.7% | 6.7pp |
| 2020-21 | 31.5% | 22.3% | 9.1pp |
| 2021-22 | 39.0% | 32.0% | 7.0pp |
| 2022-23 | 35.0% | 28.1% | 6.9pp |
| 2023-24 | 30.6% | 24.4% | 6.3pp |
| 2024-25 | 29.8% | 23.8% | 6.1pp |
The stability of the gap means that economic disadvantage is not becoming a stronger predictor of chronic absence over time. It was already a strong predictor before COVID, and it remains one. The problem is that the entire distribution has shifted upward, so the same relative gap now translates to much higher absolute rates.
In a State Where Over Half Qualify
Arizona's economically disadvantaged classification covers more than half the student population. This is not a narrow subgroup — it is the majority. When 29.8% of the majority of students are chronically absent, the consequences ripple through every school, every classroom, every teacher's ability to deliver sequential instruction.
The barriers are familiar: families in economic distress face transportation unreliability, housing instability, the pull of older children into the workforce, limited access to health care that turns minor illness into multi-day absences, and the stress of poverty itself, which makes consistent routines harder to maintain.
Recovery for economically disadvantaged students has been only slightly better than for the overall population — 47.0% recovered from the COVID peak, compared to 42.8% overall. But both have stalled. The 2024-to-2025 improvement was minimal.
At 29.8%, chronic absence for low-income students is in danger of becoming the baseline — just what happens, no longer an exception that triggers intervention. When three in ten students in the majority of classrooms are missing that much school, the question stops being "which students have a problem" and becomes "does the system work at all."
Detailed code that reproduces the analysis and figures in this article is available exclusively to EdTribune subscribers.
Discussion
Sign in to join the discussion.
Loading comments...