Correction: This prepublication draft was revised to remove unsupported context and align its comparisons with the verified attendance data.
Amphitheater Unified↗ET cut its chronic absenteeism rate from 42.8% in 2021-22 to 22.5% in 2024-25. The 20.3 percentage-point improvement across three consecutive annual transitions was the largest in the 15-district Tucson comparison set used for this analysis.
Arizona improved too, but more slowly. The statewide rate fell from 32.0% to 23.8% over the same period, an 8.3-point decline. Amphitheater moved from 10.8 points above the state rate to 1.3 points below it.
Most of the gain came in one year
The district's improvement was uneven. Its rate fell 5.0 points in 2022-23, from 42.8% to 37.8%. It then dropped 13.6 points to 24.2% in 2023-24 before declining another 1.7 points to 22.5% in 2024-25.
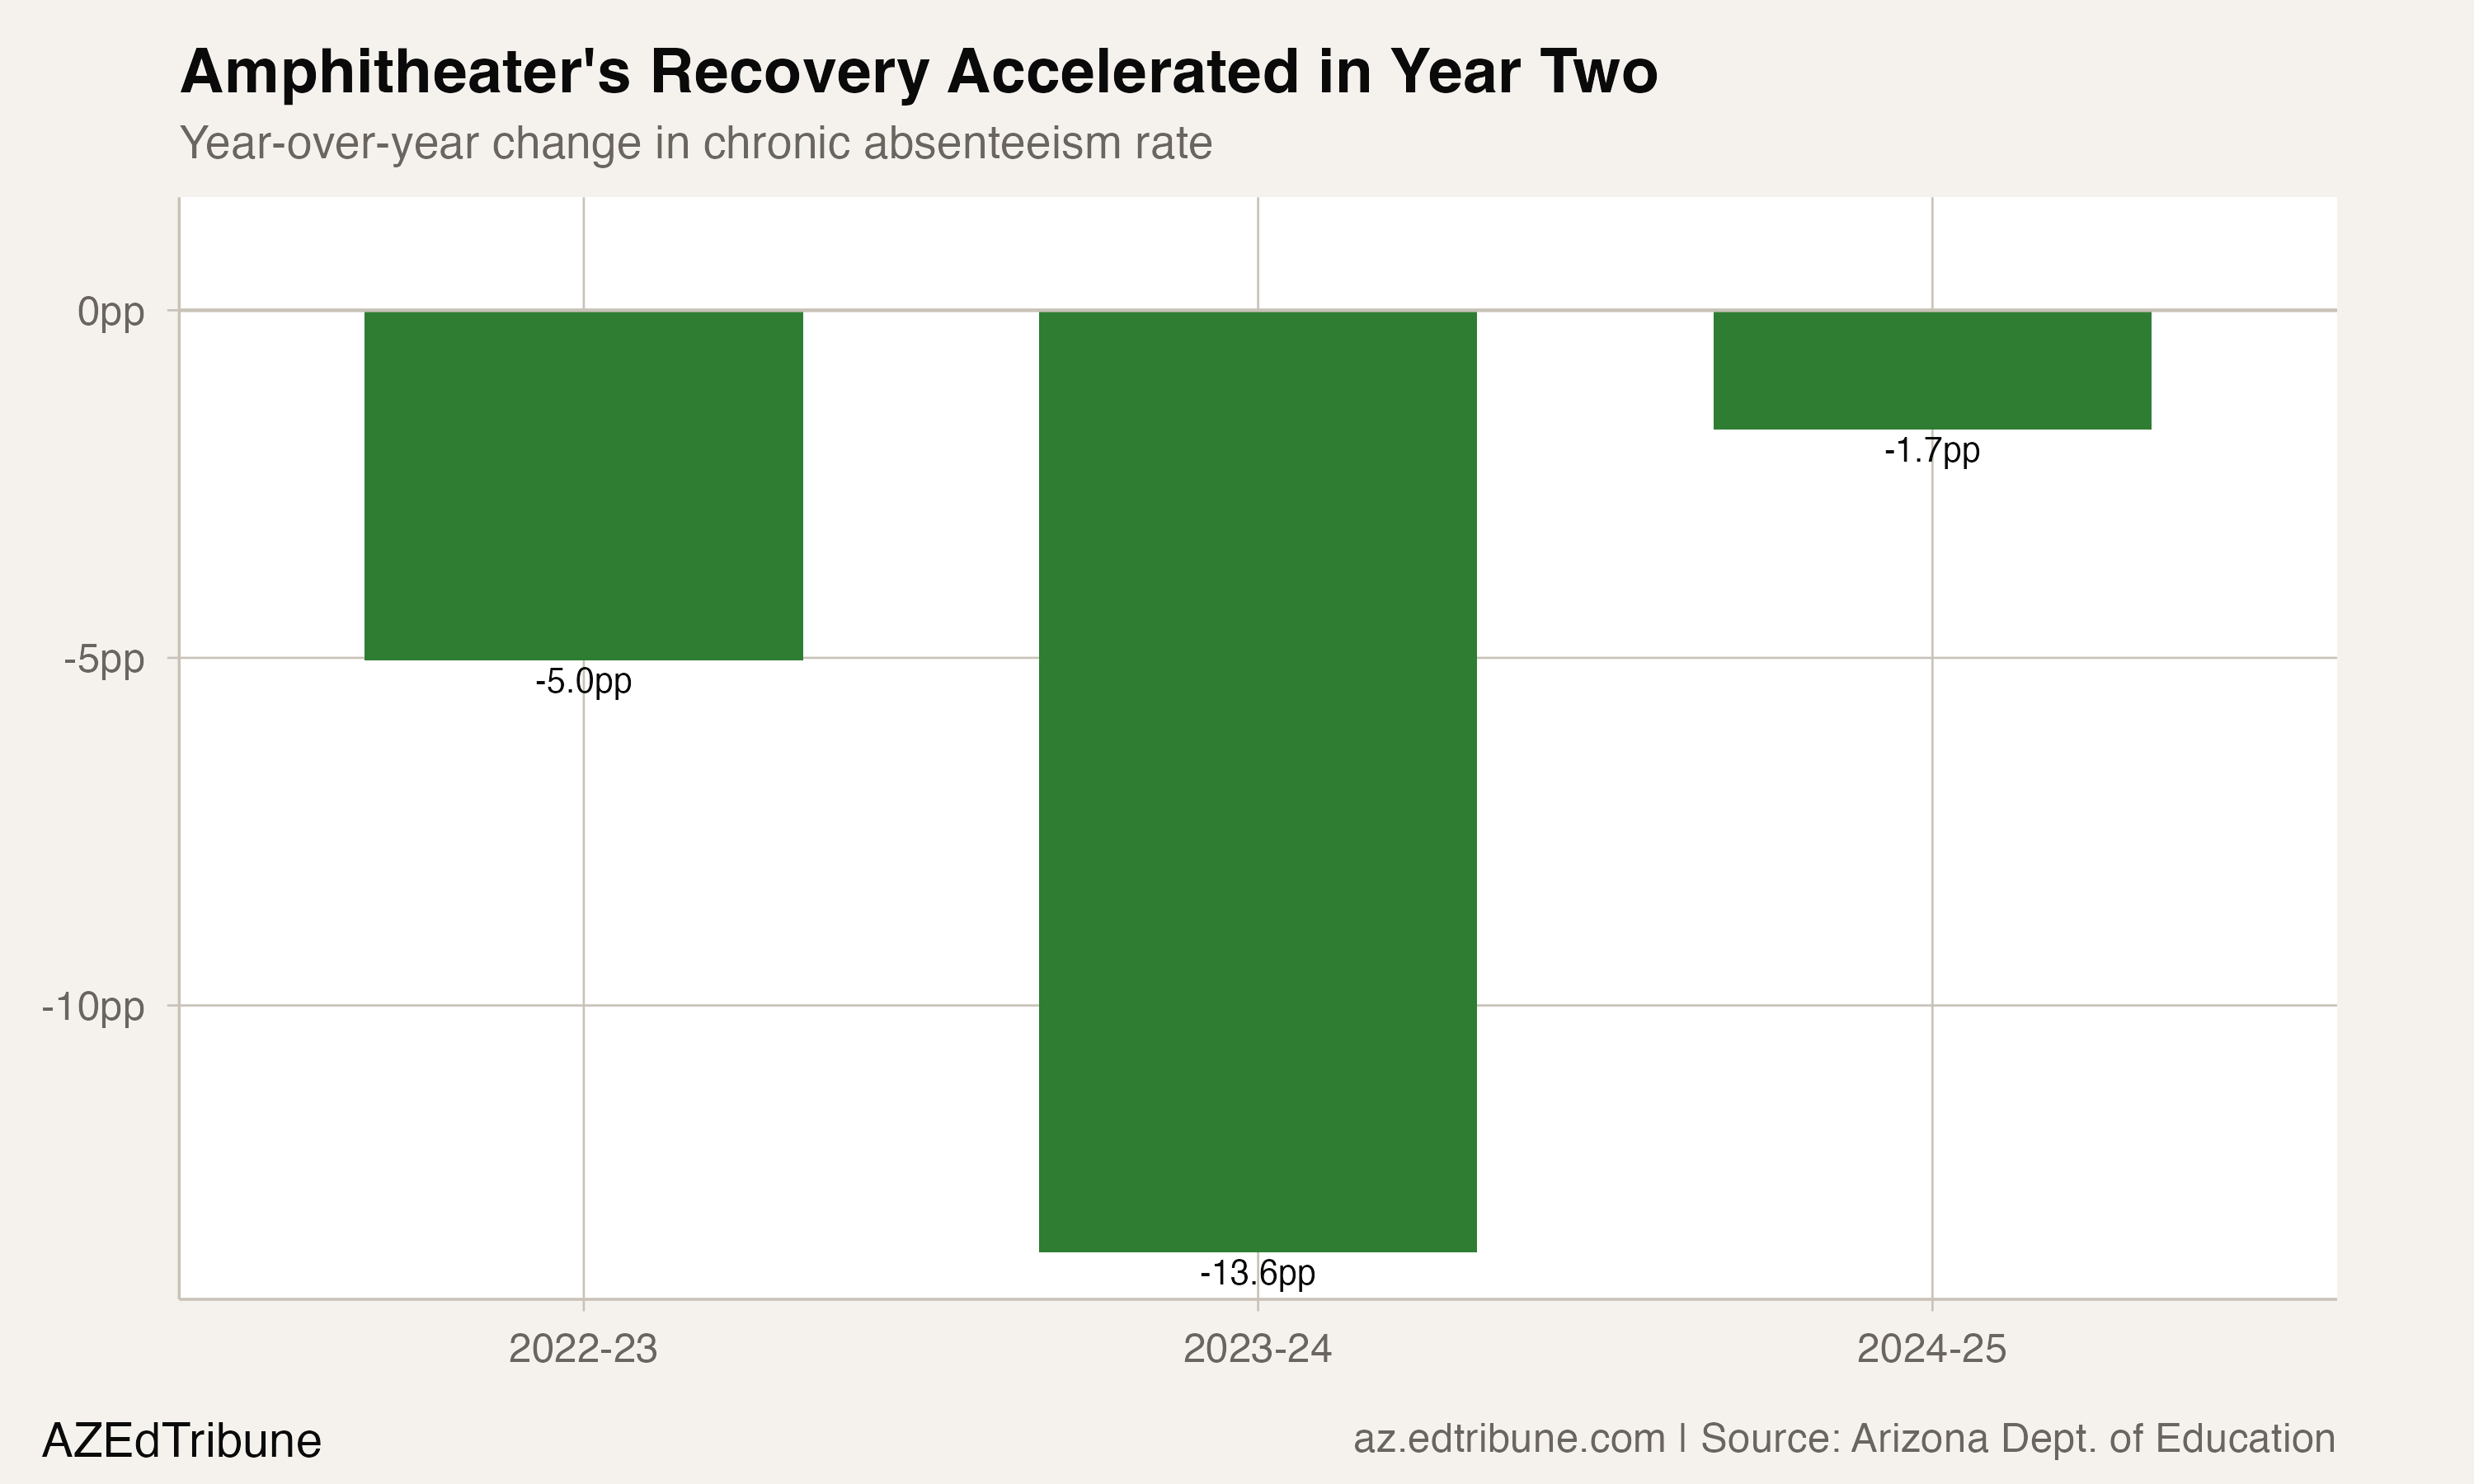
The middle transition accounted for about two-thirds of Amphitheater's full improvement. The data establishes when the decline accelerated, but it does not identify why.
The Tucson Contrast
Tucson Unified↗ET followed a different path. Its chronic absenteeism rate fell from 50.6% in 2021-22 to 33.8% in 2023-24, then rose 9.8 points to 43.6% in 2024-25. That increase erased more than half of the district's improvement from the first two transitions.
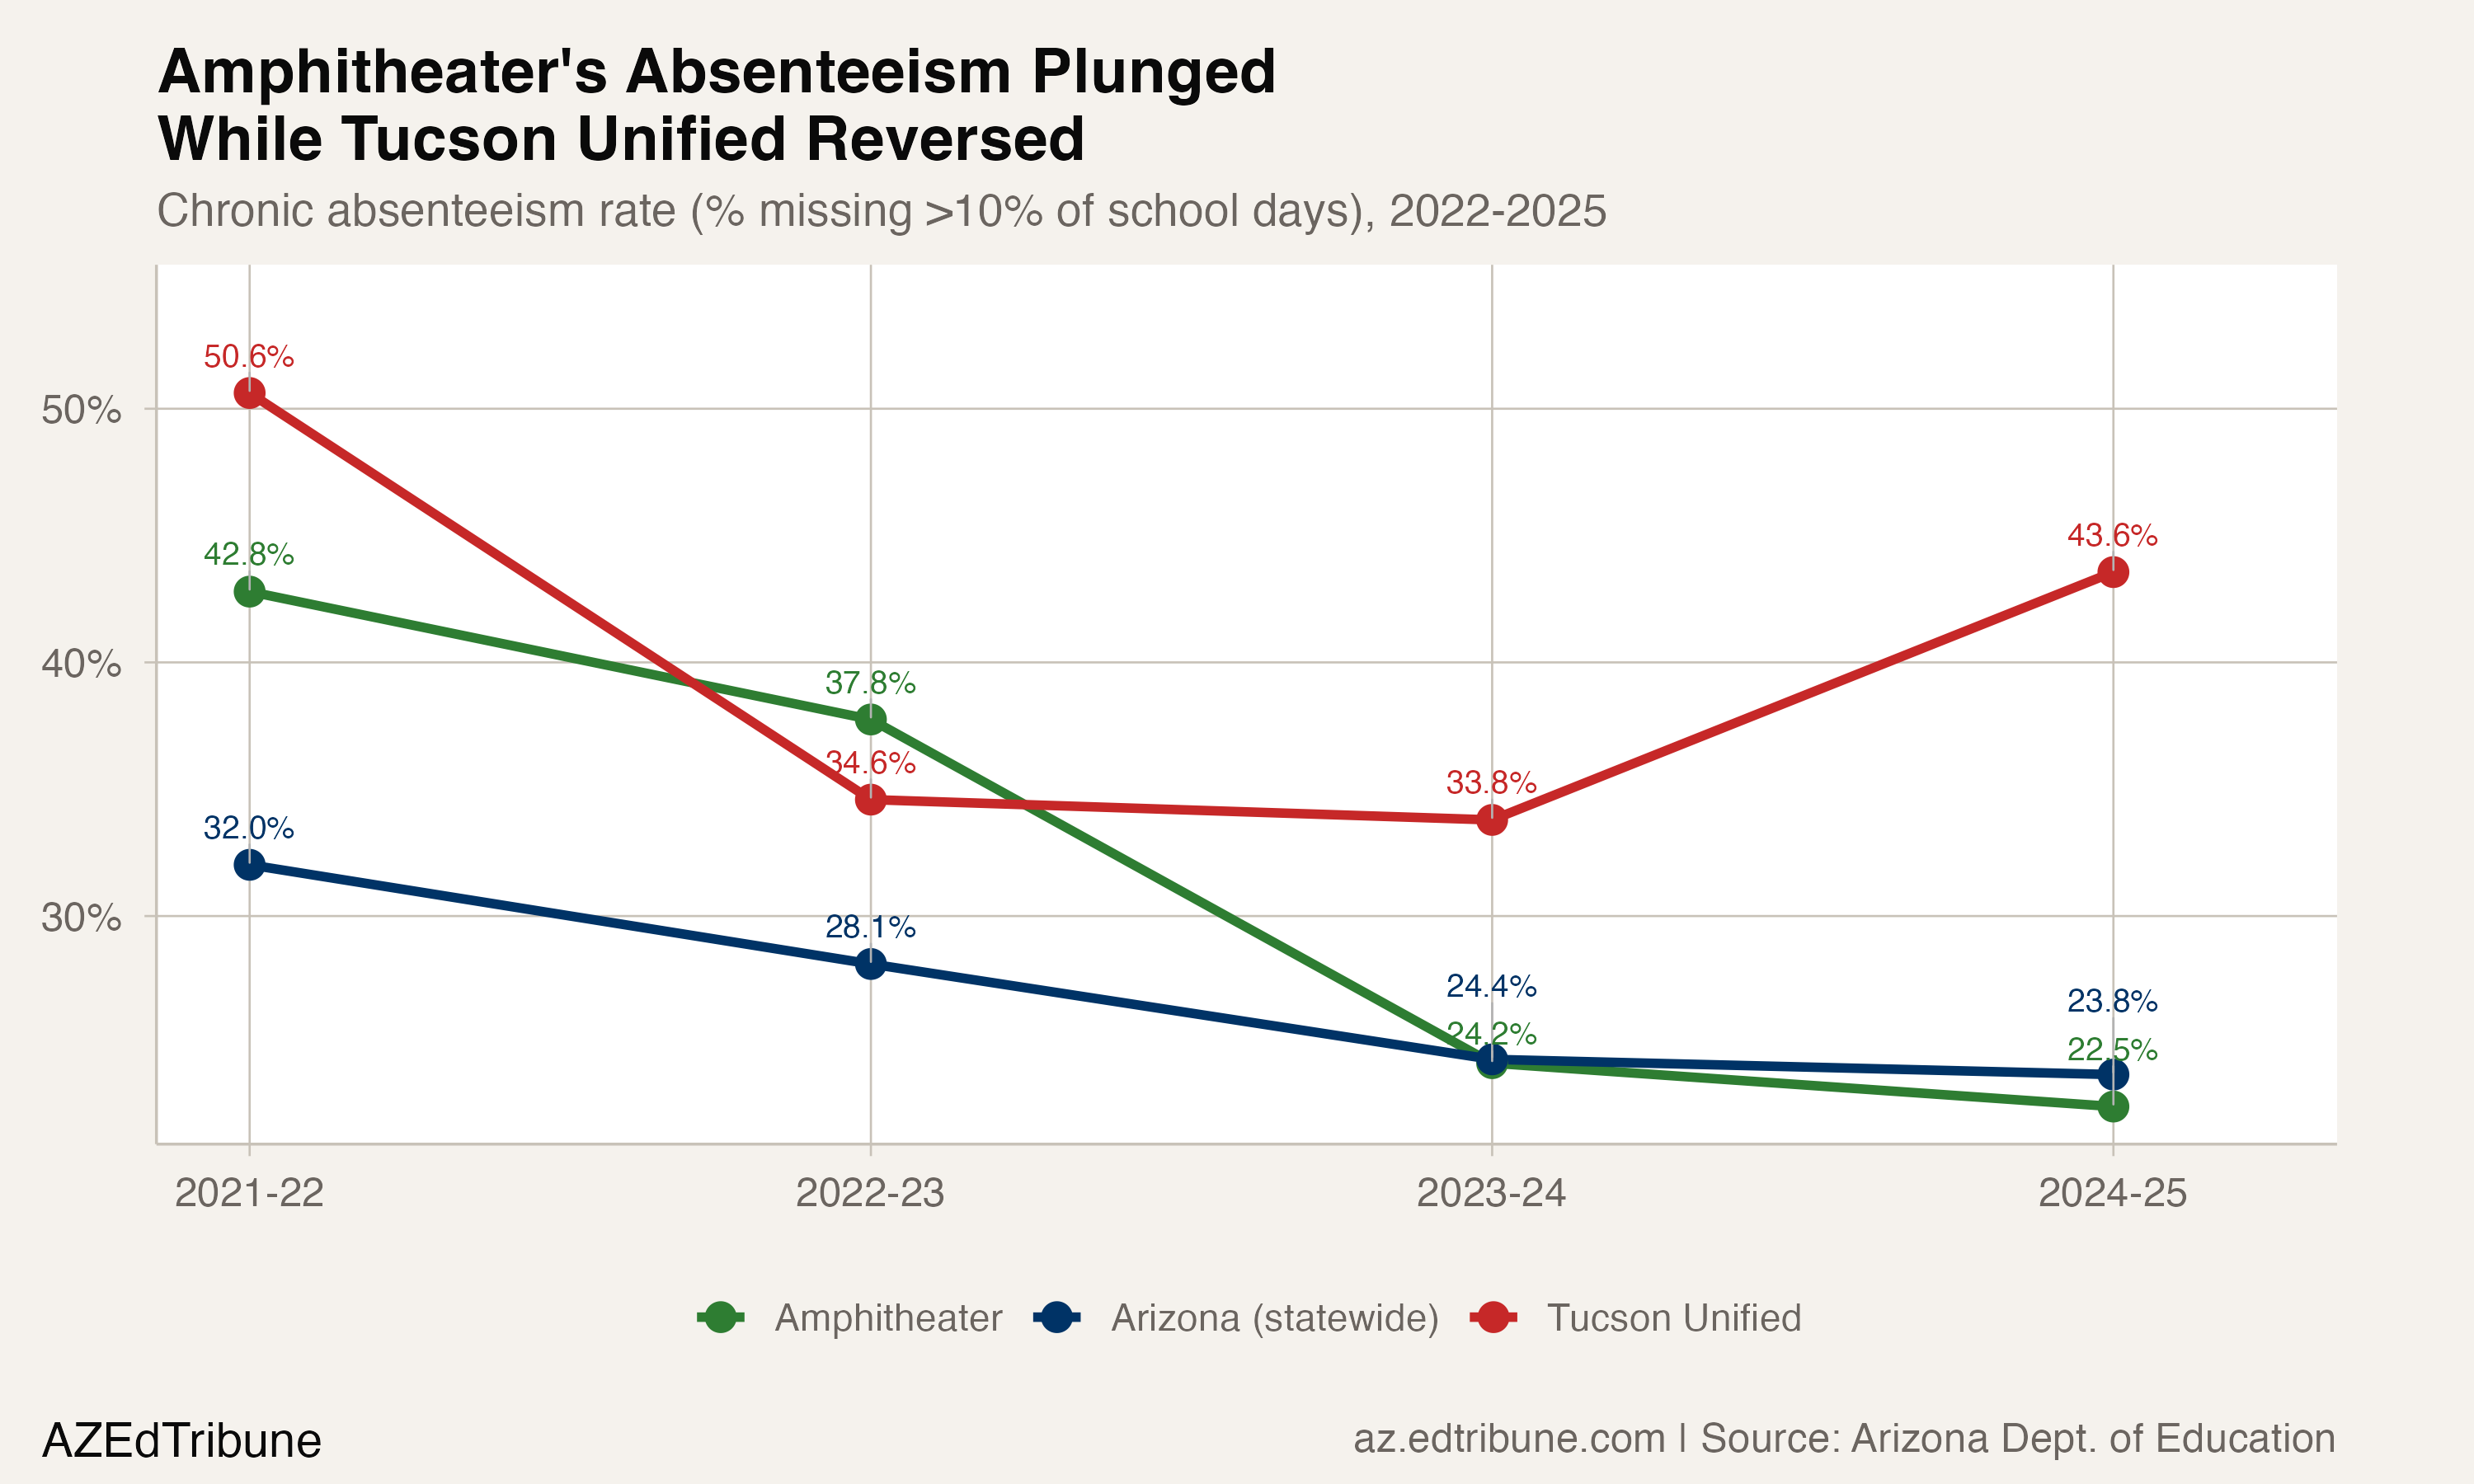
Across the full 2021-22 to 2024-25 span, Tucson Unified still improved by 7.1 points. Three entities in the comparison set finished with higher rates over that span's endpoints; the other 12 finished lower.
Published reporting provides suggestive context, not a causal explanation. KOLD News reported concerns from a Tucson Unified teacher about how excessive absences were handled, and separate reporting described weaknesses in the district's attendance tracking. Those reports do not establish what caused the latest increase.
Who Showed Up
Amphitheater's improvement appeared across the reported subgroups with comparable endpoint data. The rate for students who were economically disadvantaged fell 26.6 points, from 56.9% in 2021-22 to 30.4% in 2024-25. The rate for Native American students fell 25.9 points, from 64.2% to 38.3%. Hispanic students improved 24.2 points, from 52.0% to 27.8%, while Black students improved 23.2 points, from 43.5% to 20.3%.
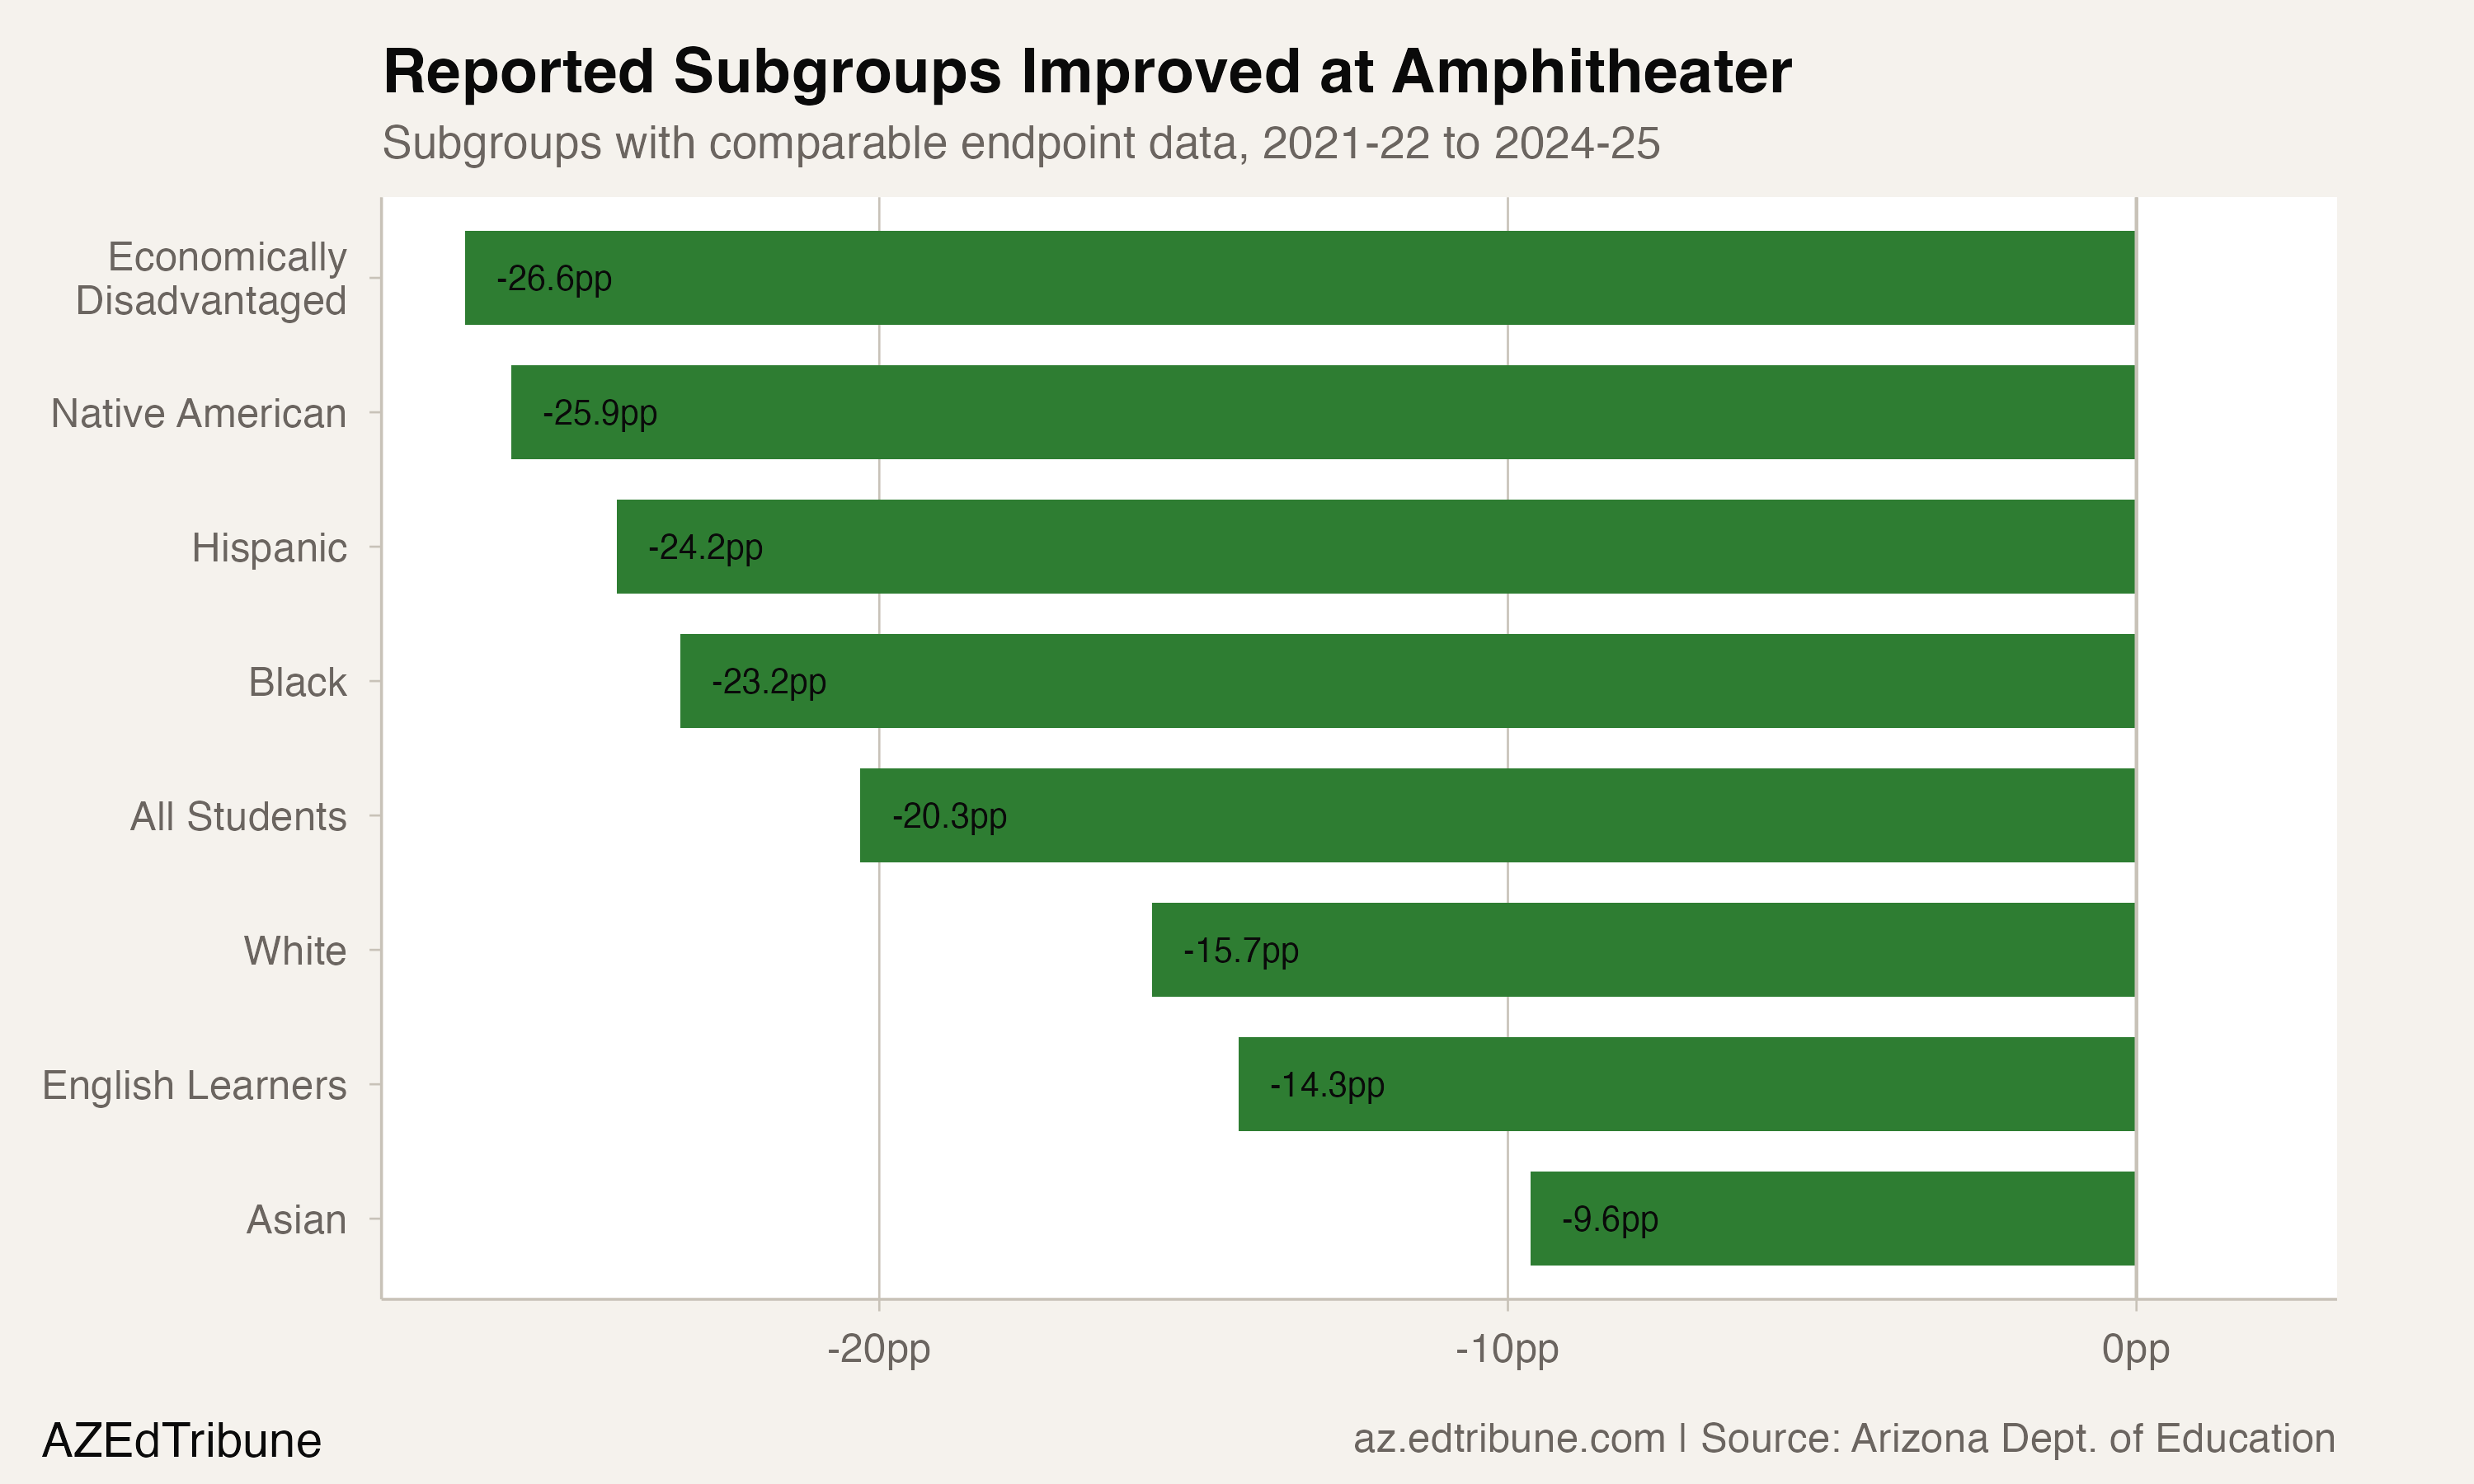
White students improved 15.7 points, from 32.4% to 16.7%. English learners improved 14.3 points, from 44.2% to 29.9%.
By 2024-25, Amphitheater's overall rate of 22.5% was below Arizona's 23.8%. Its Hispanic rate of 27.8% was effectively even with the statewide 27.9%, and its white rate of 16.7% was below the statewide 17.8%. Native American students remained above the comparable statewide rate, 38.3% versus 37.3%.
Amphitheater has publicly emphasized connection in its attendance messaging, telling families that students who miss school can feel less connected to their peers. That is direct evidence of the district's stated approach. It is not evidence that the approach produced the measured decline.
Across the Metro
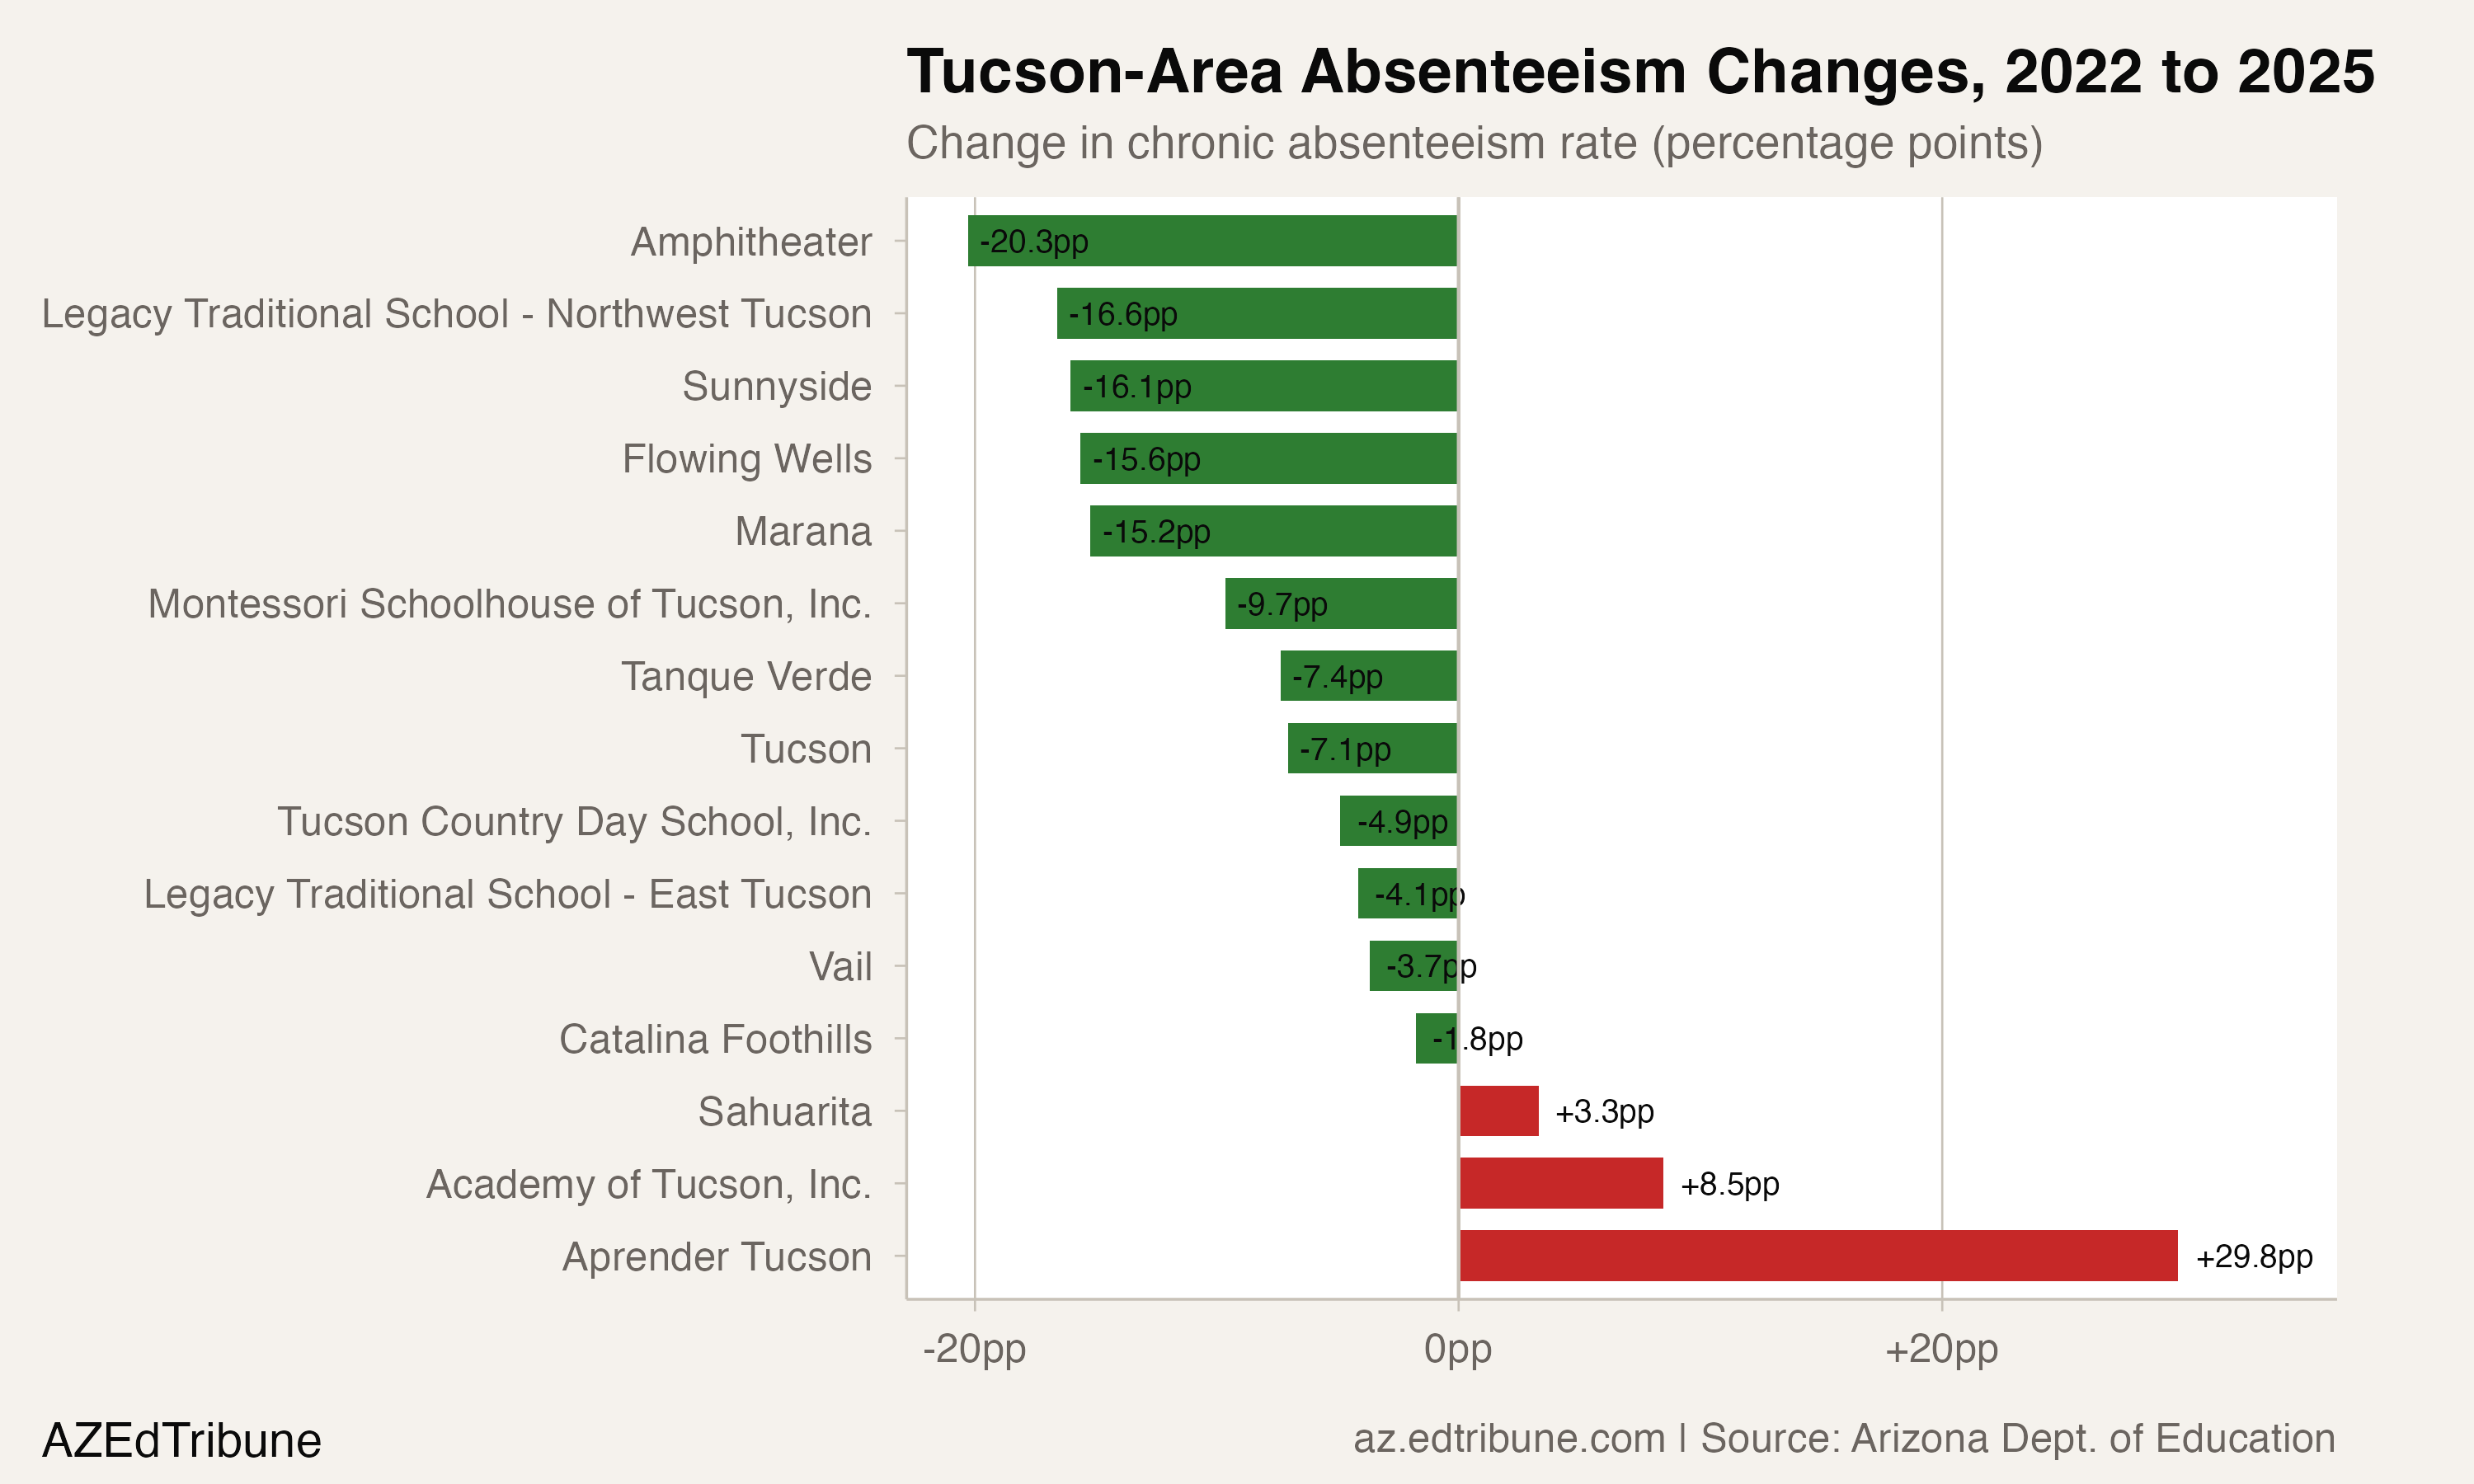
Amphitheater's improvement led the comparison set, but it was not alone. Sunnyside Unified dropped 16.1 points, from 56.4% to 40.4%. Flowing Wells fell 15.6 points, from 35.8% to 20.2%. Marana dropped 15.2 points, from 43.6% to 28.4%.
At the other end, Catalina Foothills improved 1.8 points from its 18.2% starting rate, while Vail improved 3.7 points from 24.2%. The smaller changes coincided with lower starting rates, but the data does not establish that the starting point caused the difference.
Arizona's overall rate fell from 32.0% in 2021-22 to 23.8% in 2024-25, an 8.3-point improvement. The latest rate was still about 1.9 times the 12.7% reported in 2018-19.
The next measurement
Amphitheater ended 2024-25 below the statewide rate after three straight annual improvements. One more reporting year will show whether the small final decline extended into a fourth consecutive transition or whether the district's recovery leveled off. The existing data supports the turnaround. It does not yet show whether that result will persist.
Detailed code that reproduces the analysis and figures in this article is available exclusively to EdTribune subscribers.
Discussion
Sign in to join the discussion.
Loading comments...