Correction, August 1, 2026: This version removes unsupported causal explanations and pre-pandemic comparisons, and limits the analysis to the official 2022 through 2025 package-cache output. It retains the corrected reservation-serving peer set documented in the July 27 fact check.
Whiteriver Unified District↗ET posted a 58.1% chronic-absence rate in 2022. The rate then fell to 43.2% in 2023, 35.9% in 2024, and 34.2% in 2025.
That was a 23.9-point decline across three annual transitions. Each new published rate was lower than the one before it.
The statewide gap narrowed
Arizona's statewide rate fell from 32.0% in 2022 to 23.8% in 2025, an 8.3-point decline. Whiteriver improved 15.6 points more than the state over the same endpoints.
The district's gap with Arizona narrowed from 26.1 points in 2022 to 10.4 points in 2025.
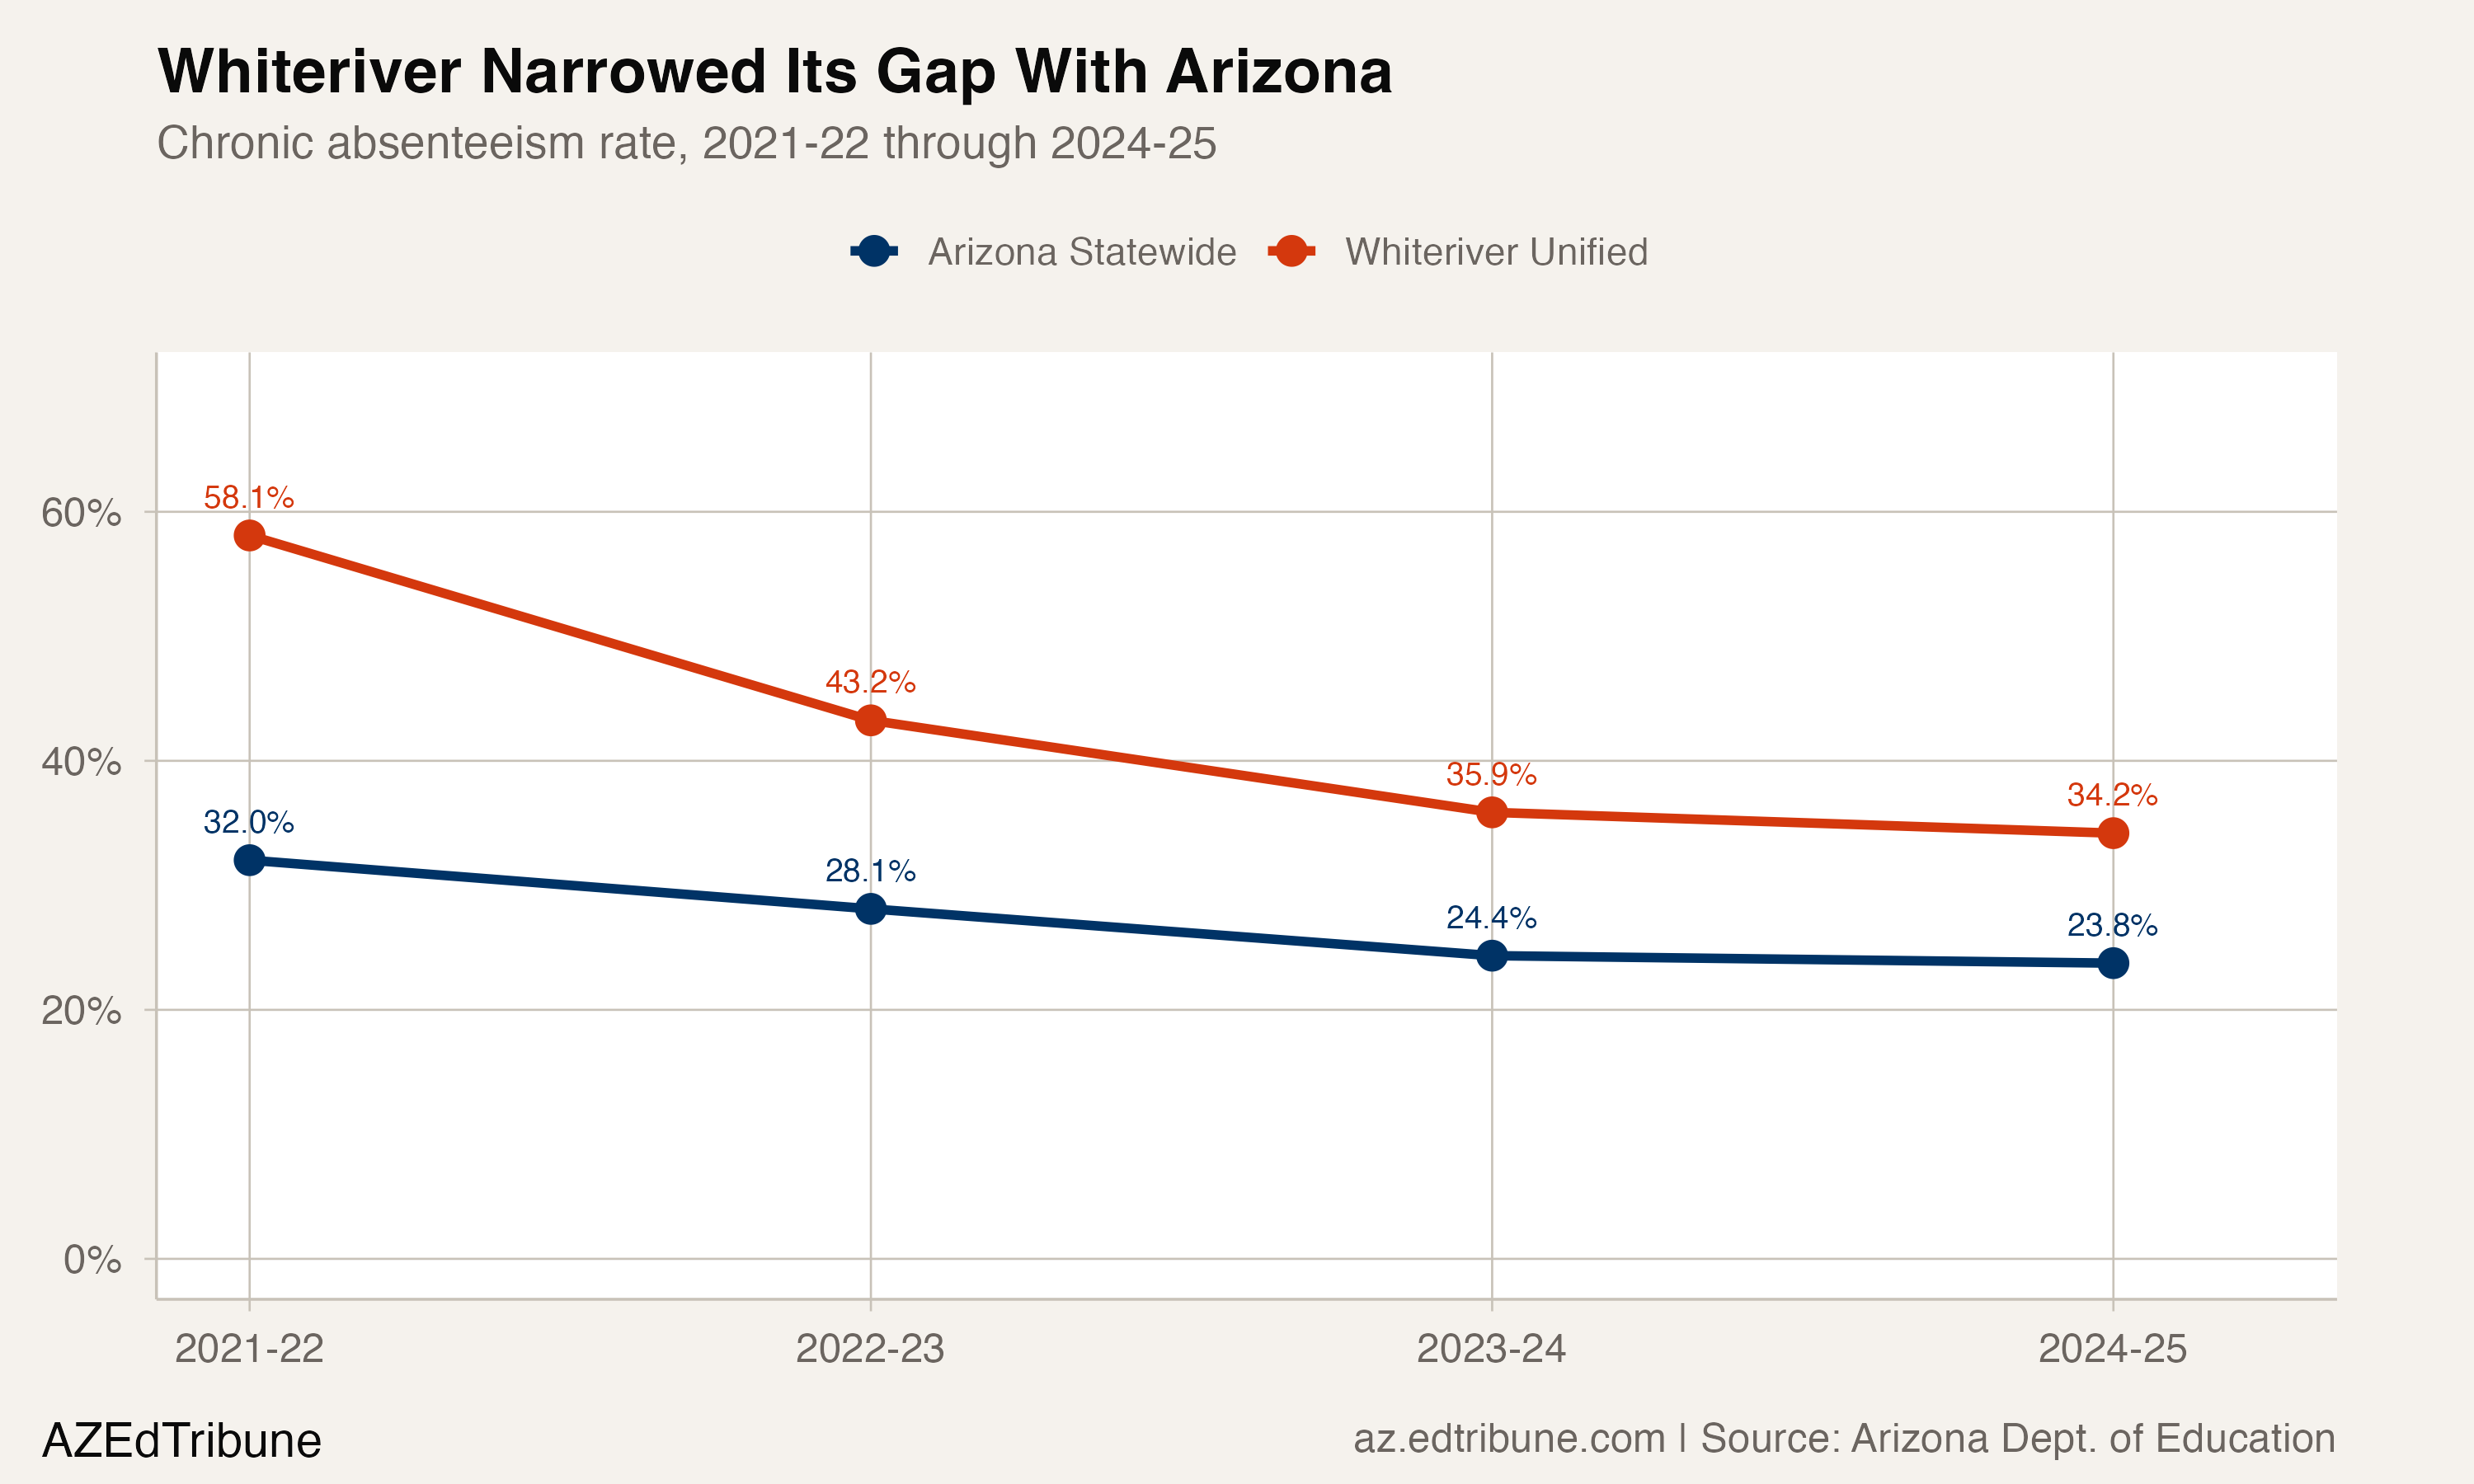
Whiteriver's annual improvement slowed over the period: 14.9 points in 2023, 7.4 points in 2024, and 1.7 points in 2025. The latest result is still an improvement, but the coded test shows a decelerating sequence.
Native American and English learner rates
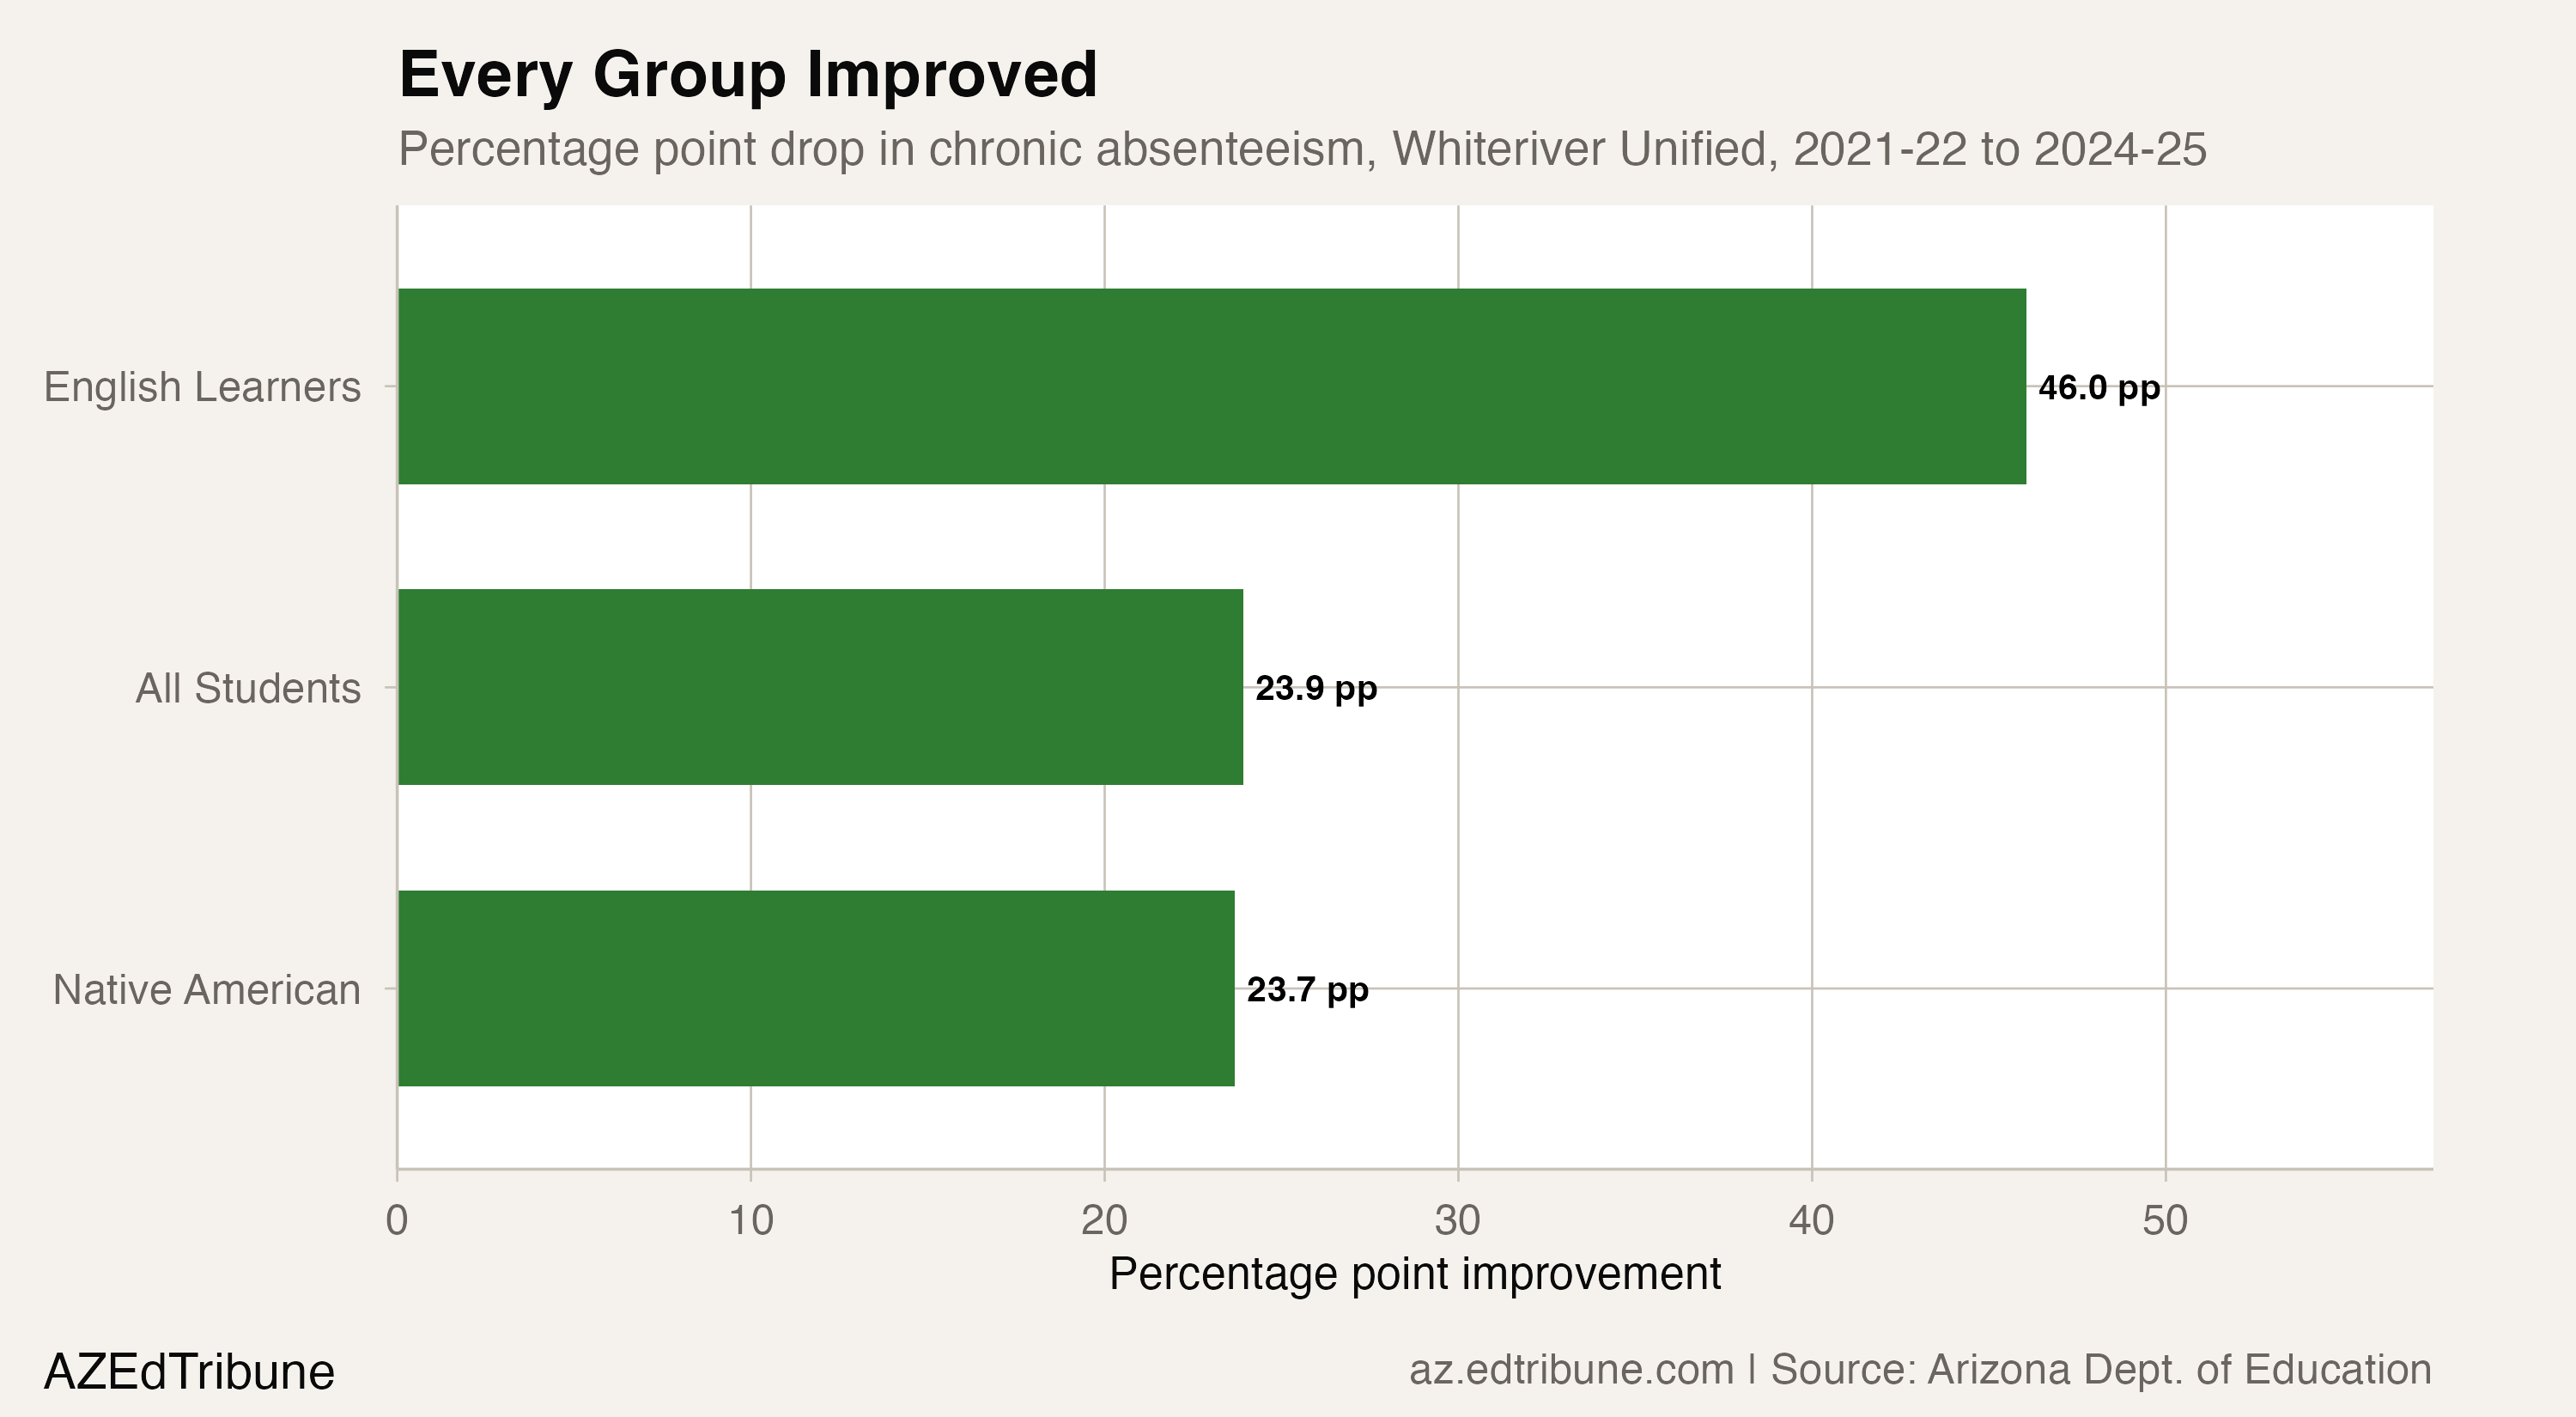
Whiteriver's Native American student rate fell from 58.2% in 2022 to 34.6% in 2025, a 23.7-point decline. Arizona's statewide Native American rate fell from 44.1% to 37.3%, a 6.8-point decline.
In 2022, Whiteriver's Native American rate was 14.1 points above the statewide Native American rate. In 2025, it was 2.7 points below it.
Whiteriver's English learner rate followed a less even path: 75.0% in 2022, 35.8% in 2023, 43.5% in 2024, and 29.0% in 2025. The net decline was 46.0 points, but the 2024 increase prevents describing it as a continuous improvement streak.
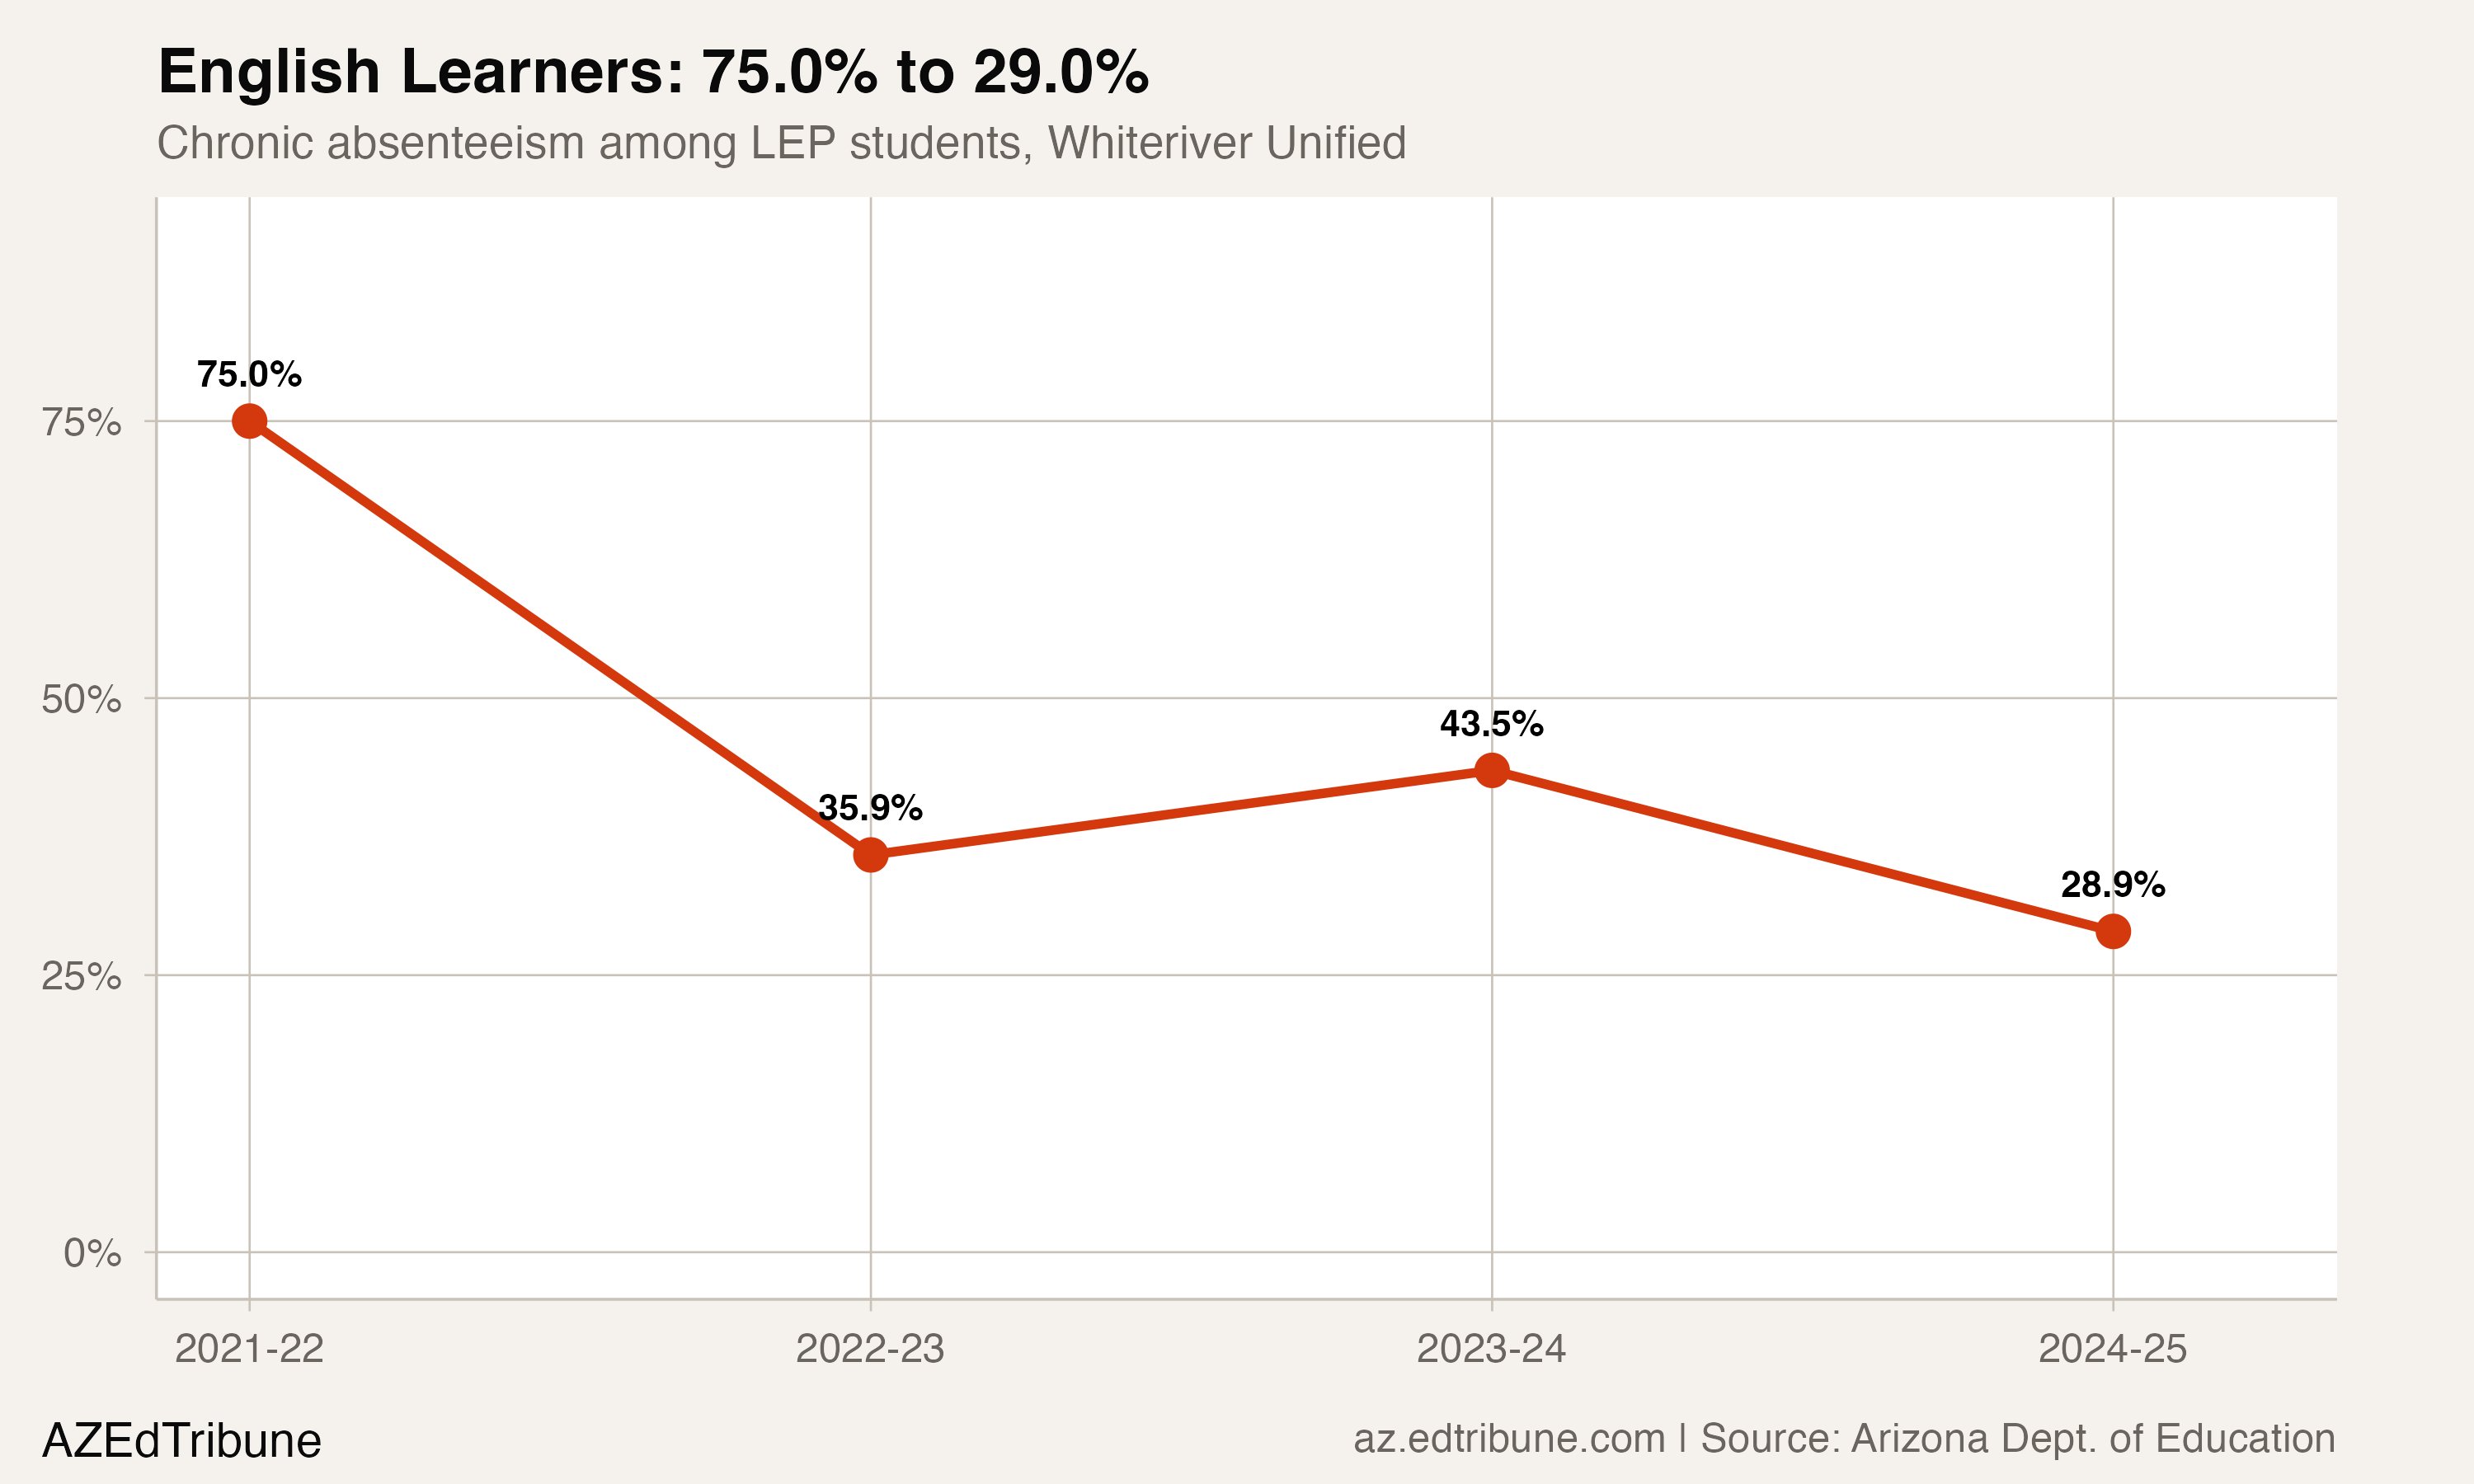
The 2025 English learner rate was 5.2 points below the district's 34.2% overall rate.
A consistent result among a defined peer set
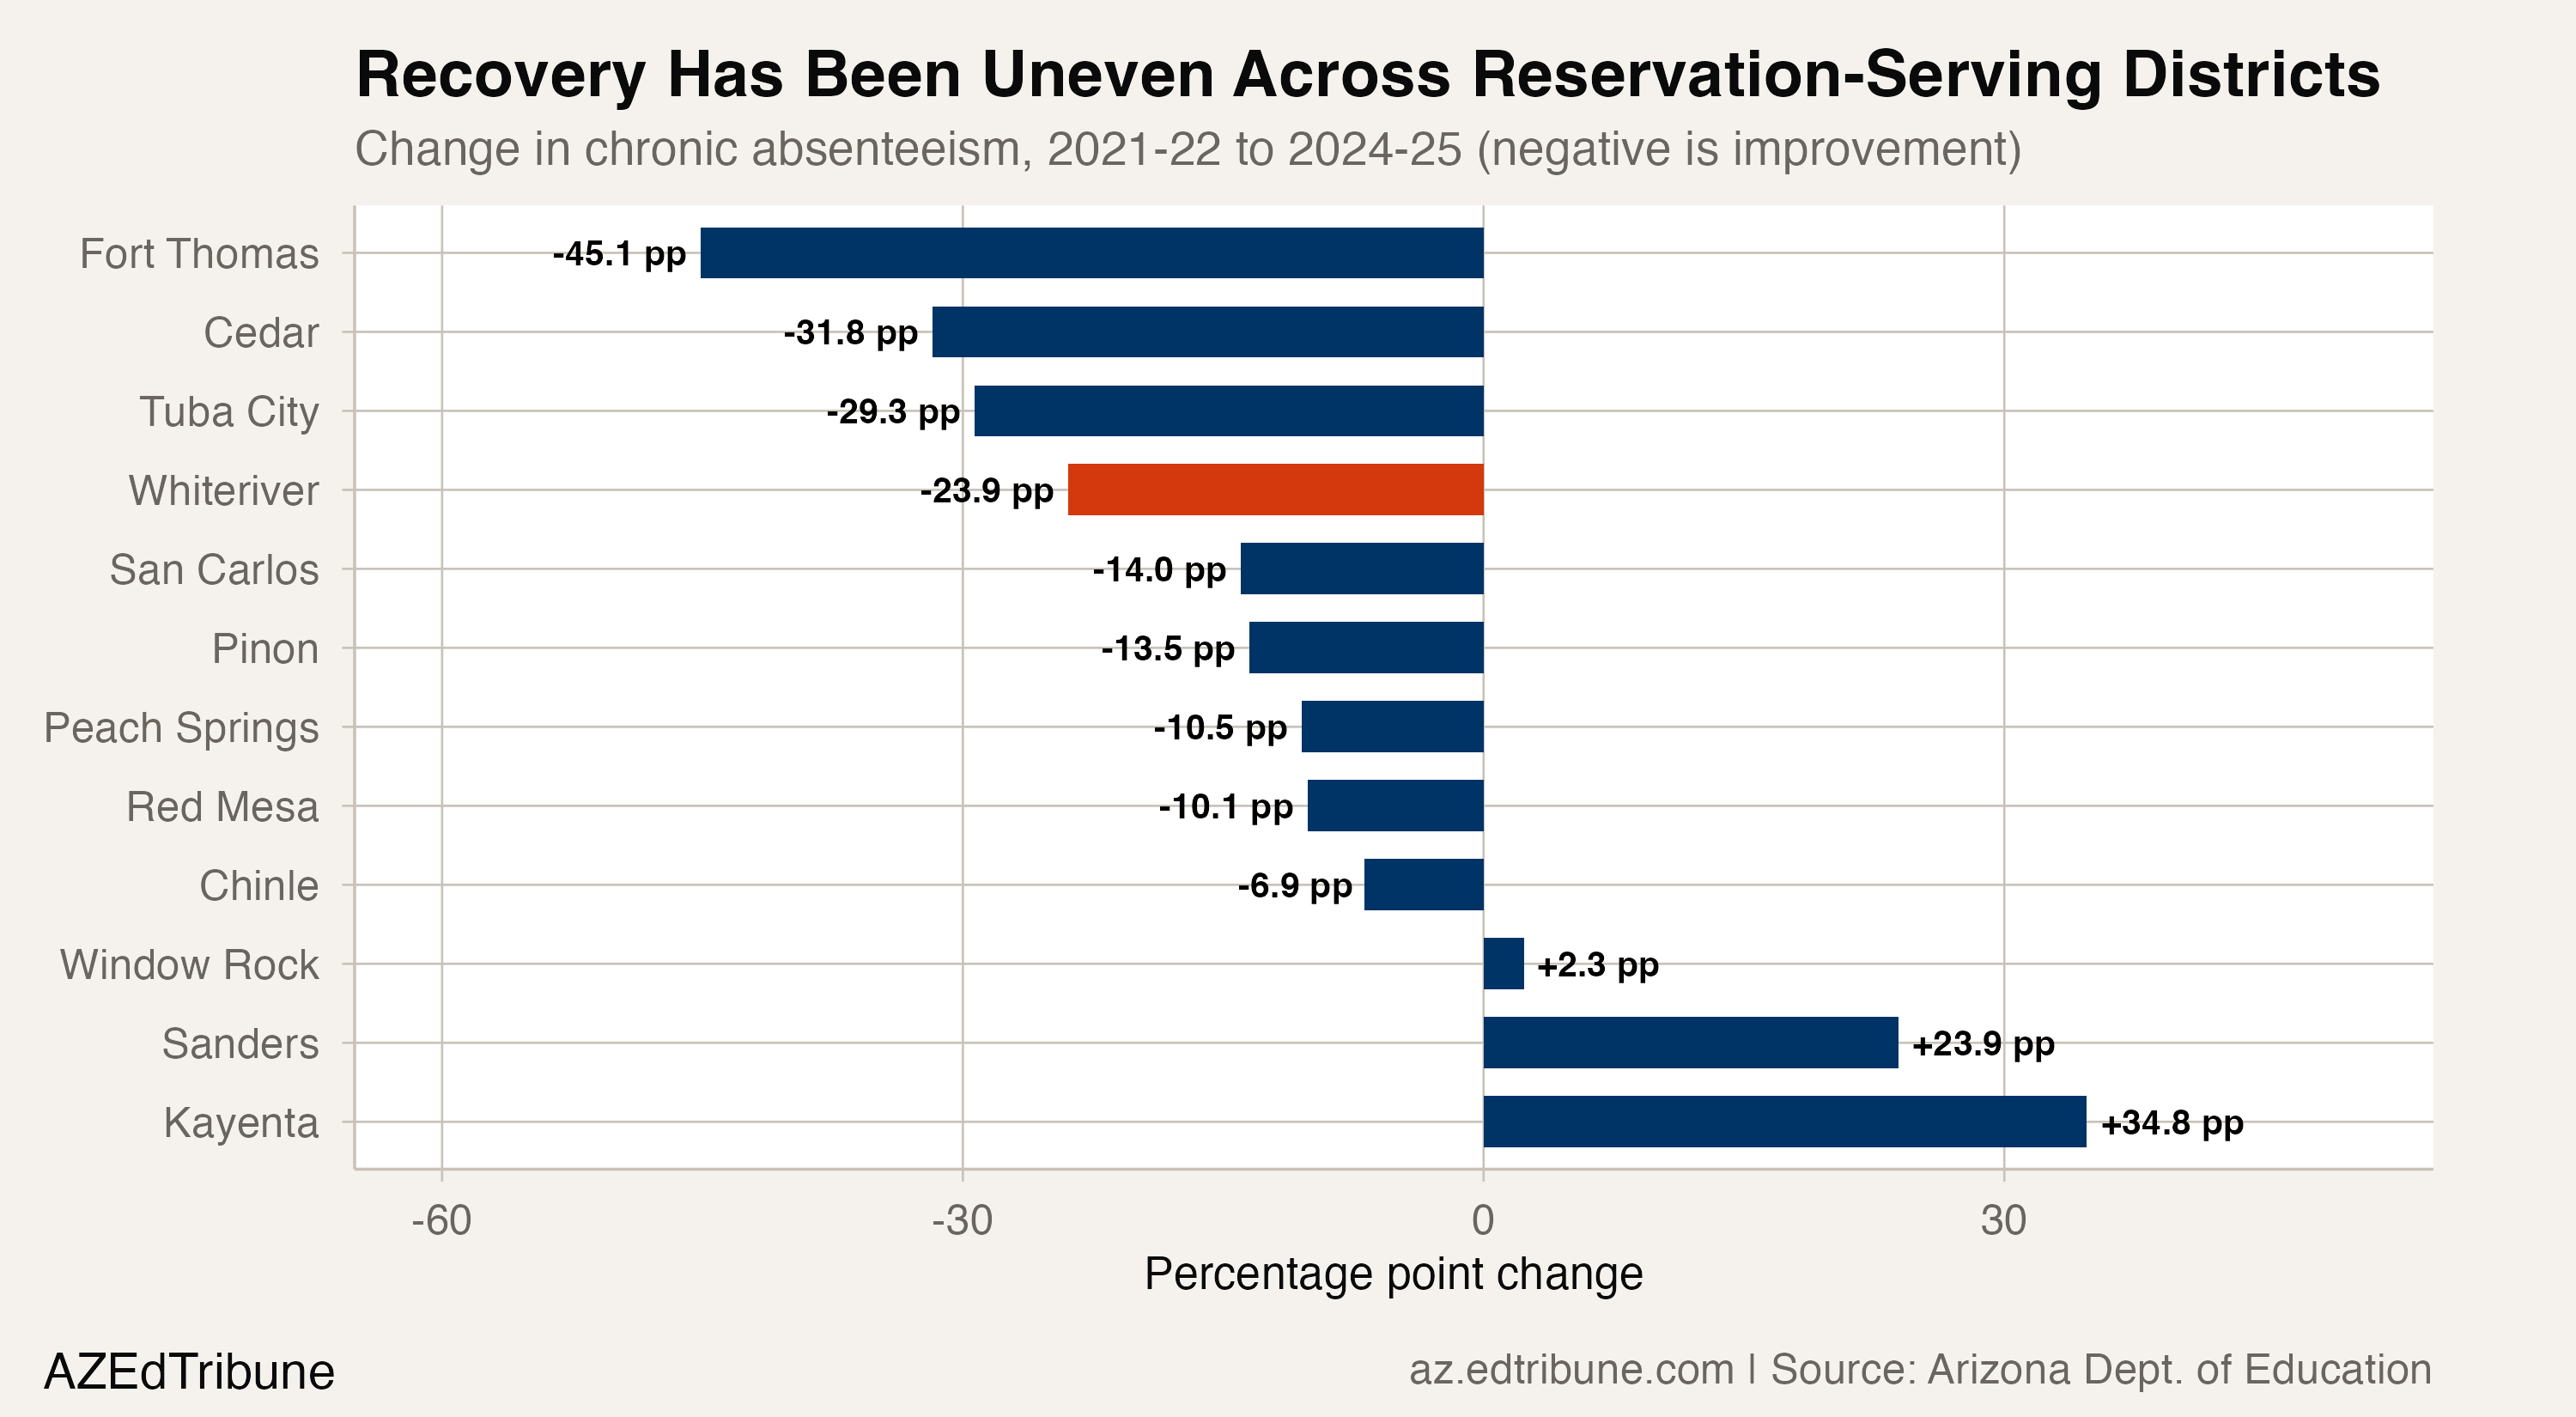
Arizona's attendance data do not publish a reservation-serving district flag. The analysis therefore uses a documented editorial set of 14 districts and verifies each one by district ID and official package name.
Twelve of those districts had rates in all four years. Four improved in each of the three annual transitions: Cedar Unified, Fort Thomas Unified, Tuba City Unified, and Whiteriver Unified.
The data establish Whiteriver's sustained decline and the comparisons above. They do not identify a transportation change, attendance program, cultural initiative, or other cause.
Detailed code that reproduces the analysis and figures in this article is available exclusively to EdTribune subscribers.
Discussion
Sign in to join the discussion.
Loading comments...